


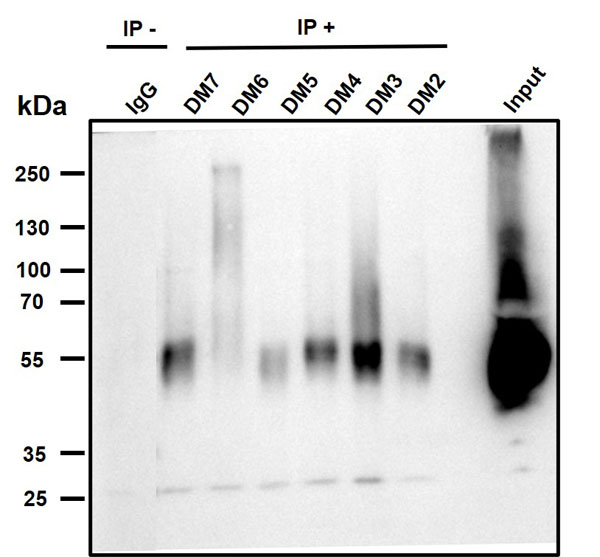
 IP (Immunoprecipitation)
(Figure 6. Immunoprecipitation analysis. Cellular overexpression lysates (made from HEK293F cells transfected with DYKDDDDK tagged human BCMA full length gene) were pre-incubated with 6 different rabbit DimAb clones and negative control IgG. The immunocomplexes were further pulled down by protein A beads, fractionated, and blotted with mouse anti-DYKDDDDK monoclonal antibody.)
IP (Immunoprecipitation)
(Figure 6. Immunoprecipitation analysis. Cellular overexpression lysates (made from HEK293F cells transfected with DYKDDDDK tagged human BCMA full length gene) were pre-incubated with 6 different rabbit DimAb clones and negative control IgG. The immunocomplexes were further pulled down by protein A beads, fractionated, and blotted with mouse anti-DYKDDDDK monoclonal antibody.)
Rabbit anti-Human BCMA Monoclonal Antibody | anti-BCMA antibody
Anti-BCMA antibody (DM4), Rabbit mAb
Preservative: 0.1%Procline 300
Constituents: 50%Glycerol; PBS, pH7.4; 0.1%BSA
IP: 1:30
Shipping: Ice Pack
IP (Immunoprecipitation)
(Figure 6. Immunoprecipitation analysis. Cellular overexpression lysates (made from HEK293F cells transfected with DYKDDDDK tagged human BCMA full length gene) were pre-incubated with 6 different rabbit DimAb clones and negative control IgG. The immunocomplexes were further pulled down by protein A beads, fractionated, and blotted with mouse anti-DYKDDDDK monoclonal antibody.)
ELISA
(Figure 5. ELISA plate was coated with recombinant BCMA-hFc fusion protein (PME100001), followed by pre-blocking with huC11D5.3 antibody (Grey bar) or rabbit control IgG (Black bar), and then different rabbit DimAbs antibodies were added to check the competitive inhibition of huC11D5.3. DM3 clone exhibits the strongest inhibition (Red bar). This data indicated that DM3 bind to the same epitope as bb2121.)
Application Data
(Figure 4. Affinity ranking of different DimAb clones by titration of rabbit DimAb antibody concentration onto K562-BCMA or NCI-H929 cells. Different concentrations of various anti-BCMA DimAb clones were incubated with K562-BCMA (A) or NCI-H929 cells (B) at 4 degree C. Bound rabbit IgG was detected in flow cytometry analysis. The Y-axis represents the mean fluorescence intensity (MFI) while the X-axis represents the concentration of IgG used.)
Application Data
(Figure 3. Phylogenetic analysis of different Anti-BCMA DimAb clones. A) heavy chain and B) Light chain.)
Application Data
(Figure 3. Phylogenetic analysis of different Anti-BCMA DimAb clones. A) heavy chain and B) Light chain.)
FCM (Flow Cytometry)
(Figure 2. A. Flow cytometry analysis with anti-BCMA (DM4) on NCI-H929 cells (Red histogram) or rabbit control antibody on NCI-H929 cells (Blue histogram). B. Flow cytometry data of serially titrated anti-BCMA (DM4) on NCI-H929 cells. The Y-axis represents the mean fluorescence intensity (MFI) while the X-axis represents the concentration of IgG used.)
FCM (Flow Cytometry)
(Figure 1. A. Flow cytometry analysis with anti-BCMA (DM4) on K562-BCMA (Red histogram) (K562 cells stably transduced by human BCMA full length gene) and K562 (Negative control cell line) (Blue histogram). B. Flow cytometry data of serially titrated anti-BCMA (DM4). The Y-axis represents the mean fluorescence intensity (MFI) while the X-axis represents the concentration of IgG used.)
Similar Products


Product Notes
The BCMA (Catalog #AAA27971) is an Antibody produced from Rabbit and is intended for research purposes only. The product is available for immediate purchase. The Anti-BCMA antibody (DM4), Rabbit mAb reacts with Human and may cross-react with other species as described in the data sheet. AAA Biotech's BCMA can be used in a range of immunoassay formats including, but not limited to, ELISA (EIA), Flow Cytometry (FC/FACS), Immunoprecipitation (IP), Immunofluorescence (IF). FC/FACS: 1:100 IP: 1:30. Researchers should empirically determine the suitability of the BCMA for an application not listed in the data sheet. Researchers commonly develop new applications and it is an integral, important part of the investigative research process. It is sometimes possible for the material contained within the vial of "BCMA, Monoclonal Antibody" to become dispersed throughout the inside of the vial, particularly around the seal of said vial, during shipment and storage. We always suggest centrifuging these vials to consolidate all of the liquid away from the lid and to the bottom of the vial prior to opening. Please be advised that certain products may require dry ice for shipping and that, if this is the case, an additional dry ice fee may also be required.Precautions
All products in the AAA Biotech catalog are strictly for research-use only, and are absolutely not suitable for use in any sort of medical, therapeutic, prophylactic, in-vivo, or diagnostic capacity. By purchasing a product from AAA Biotech, you are explicitly certifying that said products will be properly tested and used in line with industry standard. AAA Biotech and its authorized distribution partners reserve the right to refuse to fulfill any order if we have any indication that a purchaser may be intending to use a product outside of our accepted criteria.Disclaimer
Though we do strive to guarantee the information represented in this datasheet, AAA Biotech cannot be held responsible for any oversights or imprecisions. AAA Biotech reserves the right to adjust any aspect of this datasheet at any time and without notice. It is the responsibility of the customer to inform AAA Biotech of any product performance issues observed or experienced within 30 days of receipt of said product. To see additional details on this or any of our other policies, please see our Terms & Conditions page.Item has been added to Shopping Cart
If you are ready to order, navigate to Shopping Cart and get ready to checkout.