Filters
Clonality
Type
Reactivity
Gene Name
Isotype
Host
Application
Clone
164 results for " Receptors" - showing 150-164


 Application Data
(Published customer image: Increased accumulation of repair-associated macrophages surrounding collaterals in ischemic hind limbs is PAR2-dependent. (A) Stainings of CD206-positive macrophages (green) and SMA-positive vessels (red) in non-ischemic (control) and ischemic (ligated) hind limbs of WT, PAR1-/- and PAR2-/- mice are shown. Nuclei were visualized with DAPI (blue). Arrows indicate single macrophages in the non-ischemic adductor. Quantification of the average number of repair-associated macrophages per vessel is indicated on the right. (B) Correlation between the number of CD206-positive macrophages in the ischemic tissues and the expression of CD11b and (C) CD115 on monocytes. ** p)
Application Data
(Published customer image: Increased accumulation of repair-associated macrophages surrounding collaterals in ischemic hind limbs is PAR2-dependent. (A) Stainings of CD206-positive macrophages (green) and SMA-positive vessels (red) in non-ischemic (control) and ischemic (ligated) hind limbs of WT, PAR1-/- and PAR2-/- mice are shown. Nuclei were visualized with DAPI (blue). Arrows indicate single macrophages in the non-ischemic adductor. Quantification of the average number of repair-associated macrophages per vessel is indicated on the right. (B) Correlation between the number of CD206-positive macrophages in the ischemic tissues and the expression of CD11b and (C) CD115 on monocytes. ** p)
CD206, Monoclonal Antibody (Cat# AAA12118)
Full Name
RAT ANTI MOUSE CD206:Biotin
Gene Names
Mrc1; MR; CD206; AW259686
Applications
FC/FACS
Pricing


 Application Data
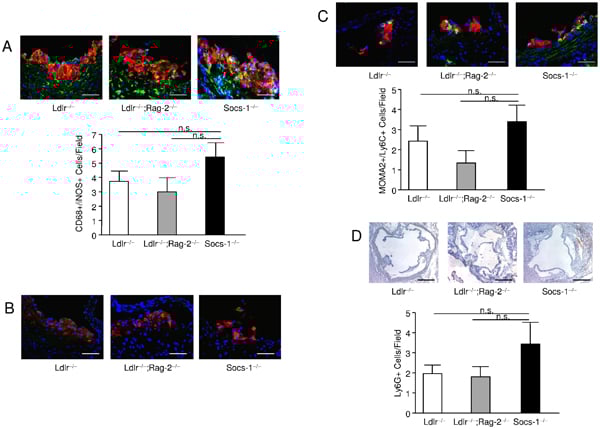
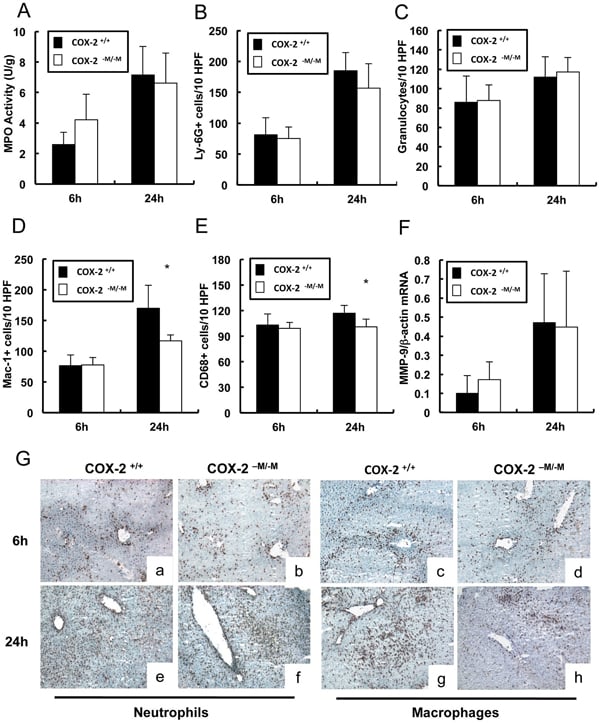
(Published customer image: Leukocyte infiltration in COX-2-M/-M and COX-2+/+ mice. MPO enzymatic activity (panel A) was statistically similar in COX-2-M/-M and COX-2+/+ livers at 6 h and 24 h post-IRI. Ly-6G+ neutrophil (panel B) and granulocyte (panel C) infiltration were also comparable in COX-2-M/-M and COX-2+/+ livers after IRI. Mac-1+ (panel D) and CD68 (panel E) infiltrating macrophages were significantly reduced in COX-2-M/-M livers at 24 h post-reperfusion, but were statistically indistinguishable in COX-2-M/-M and COX-2+/+ livers at 6 h after IRI. No statistical differences in MMP-9 expression (panel F) could be demonstrated in livers of COX-2-M/-M and COX-2+/+ mice post-IRI. Representative immunostaining (panel G) of infiltrating Ly-6G+ (a,b,e,f) and Mac-1+ (c,d,g,h) leukocytes in livers of COX-2+/+ (a,c,e,g) and COX-2-M/-M (b,d,f,h) mice at 6 h (a to d) and 24 h (e to h) post IRI; (n = 5 -6/group; * indicates p)
Application Data
(Published customer image: Leukocyte infiltration in COX-2-M/-M and COX-2+/+ mice. MPO enzymatic activity (panel A) was statistically similar in COX-2-M/-M and COX-2+/+ livers at 6 h and 24 h post-IRI. Ly-6G+ neutrophil (panel B) and granulocyte (panel C) infiltration were also comparable in COX-2-M/-M and COX-2+/+ livers after IRI. Mac-1+ (panel D) and CD68 (panel E) infiltrating macrophages were significantly reduced in COX-2-M/-M livers at 24 h post-reperfusion, but were statistically indistinguishable in COX-2-M/-M and COX-2+/+ livers at 6 h after IRI. No statistical differences in MMP-9 expression (panel F) could be demonstrated in livers of COX-2-M/-M and COX-2+/+ mice post-IRI. Representative immunostaining (panel G) of infiltrating Ly-6G+ (a,b,e,f) and Mac-1+ (c,d,g,h) leukocytes in livers of COX-2+/+ (a,c,e,g) and COX-2-M/-M (b,d,f,h) mice at 6 h (a to d) and 24 h (e to h) post IRI; (n = 5 -6/group; * indicates p)
CD68, Monoclonal Antibody (Cat# AAA12105)
Full Name
RAT ANTI MOUSE CD68:FITC
Gene Names
Cd68; Lamp4; gp110; Scard1
Applications
FC/FACS
Pricing


 Application Data
(Published customer image: Leukocyte infiltration in COX-2-M/-M and COX-2+/+ mice. MPO enzymatic activity (panel A) was statistically similar in COX-2-M/-M and COX-2+/+ livers at 6 h and 24 h post-IRI. Ly-6G+ neutrophil (panel B) and granulocyte (panel C) infiltration were also comparable in COX-2-M/-M and COX-2+/+ livers after IRI. Mac-1+ (panel D) and CD68 (panel E) infiltrating macrophages were significantly reduced in COX-2-M/-M livers at 24 h post-reperfusion, but were statistically indistinguishable in COX-2-M/-M and COX-2+/+ livers at 6 h after IRI. No statistical differences in MMP-9 expression (panel F) could be demonstrated in livers of COX-2-M/-M and COX-2+/+ mice post-IRI. Representative immunostaining (panel G) of infiltrating Ly-6G+ (a,b,e,f) and Mac-1+ (c,d,g,h) leukocytes in livers of COX-2+/+ (a,c,e,g) and COX-2-M/-M (b,d,f,h) mice at 6 h (a to d) and 24 h (e to h) post IRI; (n = 5 -6/group; * indicates p)
Application Data
(Published customer image: Leukocyte infiltration in COX-2-M/-M and COX-2+/+ mice. MPO enzymatic activity (panel A) was statistically similar in COX-2-M/-M and COX-2+/+ livers at 6 h and 24 h post-IRI. Ly-6G+ neutrophil (panel B) and granulocyte (panel C) infiltration were also comparable in COX-2-M/-M and COX-2+/+ livers after IRI. Mac-1+ (panel D) and CD68 (panel E) infiltrating macrophages were significantly reduced in COX-2-M/-M livers at 24 h post-reperfusion, but were statistically indistinguishable in COX-2-M/-M and COX-2+/+ livers at 6 h after IRI. No statistical differences in MMP-9 expression (panel F) could be demonstrated in livers of COX-2-M/-M and COX-2+/+ mice post-IRI. Representative immunostaining (panel G) of infiltrating Ly-6G+ (a,b,e,f) and Mac-1+ (c,d,g,h) leukocytes in livers of COX-2+/+ (a,c,e,g) and COX-2-M/-M (b,d,f,h) mice at 6 h (a to d) and 24 h (e to h) post IRI; (n = 5 -6/group; * indicates p)
CD68, Monoclonal Antibody (Cat# AAA12104)
Full Name
RAT ANTI MOUSE CD68:Biotin
Gene Names
Cd68; Lamp4; gp110; Scard1
Applications
FC/FACS
Pricing


 Application Data
(Published customer image: Leukocyte infiltration in COX-2-M/-M and COX-2+/+ mice. MPO enzymatic activity (panel A) was statistically similar in COX-2-M/-M and COX-2+/+ livers at 6 h and 24 h post-IRI. Ly-6G+ neutrophil (panel B) and granulocyte (panel C) infiltration were also comparable in COX-2-M/-M and COX-2+/+ livers after IRI. Mac-1+ (panel D) and CD68 (panel E) infiltrating macrophages were significantly reduced in COX-2-M/-M livers at 24 h post-reperfusion, but were statistically indistinguishable in COX-2-M/-M and COX-2+/+ livers at 6 h after IRI. No statistical differences in MMP-9 expression (panel F) could be demonstrated in livers of COX-2-M/-M and COX-2+/+ mice post-IRI. Representative immunostaining (panel G) of infiltrating Ly-6G+ (a,b,e,f) and Mac-1+ (c,d,g,h) leukocytes in livers of COX-2+/+ (a,c,e,g) and COX-2-M/-M (b,d,f,h) mice at 6 h (a to d) and 24 h (e to h) post IRI; (n = 5 -6/group; * indicates p)
Application Data
(Published customer image: Leukocyte infiltration in COX-2-M/-M and COX-2+/+ mice. MPO enzymatic activity (panel A) was statistically similar in COX-2-M/-M and COX-2+/+ livers at 6 h and 24 h post-IRI. Ly-6G+ neutrophil (panel B) and granulocyte (panel C) infiltration were also comparable in COX-2-M/-M and COX-2+/+ livers after IRI. Mac-1+ (panel D) and CD68 (panel E) infiltrating macrophages were significantly reduced in COX-2-M/-M livers at 24 h post-reperfusion, but were statistically indistinguishable in COX-2-M/-M and COX-2+/+ livers at 6 h after IRI. No statistical differences in MMP-9 expression (panel F) could be demonstrated in livers of COX-2-M/-M and COX-2+/+ mice post-IRI. Representative immunostaining (panel G) of infiltrating Ly-6G+ (a,b,e,f) and Mac-1+ (c,d,g,h) leukocytes in livers of COX-2+/+ (a,c,e,g) and COX-2-M/-M (b,d,f,h) mice at 6 h (a to d) and 24 h (e to h) post IRI; (n = 5 -6/group; * indicates p)
CD68, Monoclonal Antibody (Cat# AAA12108)
Full Name
RAT ANTI MOUSE CD68:RPE
Gene Names
Cd68; Lamp4; gp110; Scard1
Applications
FC/FACS
Pricing


 Application Data
(Published customer image: Leukocyte infiltration in COX-2-M/-M and COX-2+/+ mice. MPO enzymatic activity (panel A) was statistically similar in COX-2-M/-M and COX-2+/+ livers at 6 h and 24 h post-IRI. Ly-6G+ neutrophil (panel B) and granulocyte (panel C) infiltration were also comparable in COX-2-M/-M and COX-2+/+ livers after IRI. Mac-1+ (panel D) and CD68 (panel E) infiltrating macrophages were significantly reduced in COX-2-M/-M livers at 24 h post-reperfusion, but were statistically indistinguishable in COX-2-M/-M and COX-2+/+ livers at 6 h after IRI. No statistical differences in MMP-9 expression (panel F) could be demonstrated in livers of COX-2-M/-M and COX-2+/+ mice post-IRI. Representative immunostaining (panel G) of infiltrating Ly-6G+ (a,b,e,f) and Mac-1+ (c,d,g,h) leukocytes in livers of COX-2+/+ (a,c,e,g) and COX-2-M/-M (b,d,f,h) mice at 6 h (a to d) and 24 h (e to h) post IRI; (n = 5 -6/group; * indicates p)
Application Data
(Published customer image: Leukocyte infiltration in COX-2-M/-M and COX-2+/+ mice. MPO enzymatic activity (panel A) was statistically similar in COX-2-M/-M and COX-2+/+ livers at 6 h and 24 h post-IRI. Ly-6G+ neutrophil (panel B) and granulocyte (panel C) infiltration were also comparable in COX-2-M/-M and COX-2+/+ livers after IRI. Mac-1+ (panel D) and CD68 (panel E) infiltrating macrophages were significantly reduced in COX-2-M/-M livers at 24 h post-reperfusion, but were statistically indistinguishable in COX-2-M/-M and COX-2+/+ livers at 6 h after IRI. No statistical differences in MMP-9 expression (panel F) could be demonstrated in livers of COX-2-M/-M and COX-2+/+ mice post-IRI. Representative immunostaining (panel G) of infiltrating Ly-6G+ (a,b,e,f) and Mac-1+ (c,d,g,h) leukocytes in livers of COX-2+/+ (a,c,e,g) and COX-2-M/-M (b,d,f,h) mice at 6 h (a to d) and 24 h (e to h) post IRI; (n = 5 -6/group; * indicates p)
CD68, Monoclonal Antibody (Cat# AAA12109)
Full Name
RAT ANTI MOUSE CD68:RPE
Gene Names
Cd68; Lamp4; gp110; Scard1
Applications
FC/FACS
Pricing


 Application Data
(Published customer image: Leukocyte infiltration in COX-2-M/-M and COX-2+/+ mice. MPO enzymatic activity (panel A) was statistically similar in COX-2-M/-M and COX-2+/+ livers at 6 h and 24 h post-IRI. Ly-6G+ neutrophil (panel B) and granulocyte (panel C) infiltration were also comparable in COX-2-M/-M and COX-2+/+ livers after IRI. Mac-1+ (panel D) and CD68 (panel E) infiltrating macrophages were significantly reduced in COX-2-M/-M livers at 24 h post-reperfusion, but were statistically indistinguishable in COX-2-M/-M and COX-2+/+ livers at 6 h after IRI. No statistical differences in MMP-9 expression (panel F) could be demonstrated in livers of COX-2-M/-M and COX-2+/+ mice post-IRI. Representative immunostaining (panel G) of infiltrating Ly-6G+ (a,b,e,f) and Mac-1+ (c,d,g,h) leukocytes in livers of COX-2+/+ (a,c,e,g) and COX-2-M/-M (b,d,f,h) mice at 6 h (a to d) and 24 h (e to h) post IRI; (n = 5 -6/group; * indicates p)
Application Data
(Published customer image: Leukocyte infiltration in COX-2-M/-M and COX-2+/+ mice. MPO enzymatic activity (panel A) was statistically similar in COX-2-M/-M and COX-2+/+ livers at 6 h and 24 h post-IRI. Ly-6G+ neutrophil (panel B) and granulocyte (panel C) infiltration were also comparable in COX-2-M/-M and COX-2+/+ livers after IRI. Mac-1+ (panel D) and CD68 (panel E) infiltrating macrophages were significantly reduced in COX-2-M/-M livers at 24 h post-reperfusion, but were statistically indistinguishable in COX-2-M/-M and COX-2+/+ livers at 6 h after IRI. No statistical differences in MMP-9 expression (panel F) could be demonstrated in livers of COX-2-M/-M and COX-2+/+ mice post-IRI. Representative immunostaining (panel G) of infiltrating Ly-6G+ (a,b,e,f) and Mac-1+ (c,d,g,h) leukocytes in livers of COX-2+/+ (a,c,e,g) and COX-2-M/-M (b,d,f,h) mice at 6 h (a to d) and 24 h (e to h) post IRI; (n = 5 -6/group; * indicates p)
CD68, Monoclonal Antibody (Cat# AAA12102)
Full Name
RAT ANTI MOUSE CD68
Gene Names
Cd68; Lamp4; gp110; Scard1
Applications
FC/FACS, IF, IP, WB
Pricing


 Application Data
(Published customer image: Leukocyte infiltration in COX-2-M/-M and COX-2+/+ mice. MPO enzymatic activity (panel A) was statistically similar in COX-2-M/-M and COX-2+/+ livers at 6 h and 24 h post-IRI. Ly-6G+ neutrophil (panel B) and granulocyte (panel C) infiltration were also comparable in COX-2-M/-M and COX-2+/+ livers after IRI. Mac-1+ (panel D) and CD68 (panel E) infiltrating macrophages were significantly reduced in COX-2-M/-M livers at 24 h post-reperfusion, but were statistically indistinguishable in COX-2-M/-M and COX-2+/+ livers at 6 h after IRI. No statistical differences in MMP-9 expression (panel F) could be demonstrated in livers of COX-2-M/-M and COX-2+/+ mice post-IRI. Representative immunostaining (panel G) of infiltrating Ly-6G+ (a,b,e,f) and Mac-1+ (c,d,g,h) leukocytes in livers of COX-2+/+ (a,c,e,g) and COX-2-M/-M (b,d,f,h) mice at 6 h (a to d) and 24 h (e to h) post IRI; (n = 5 -6/group; * indicates p)
Application Data
(Published customer image: Leukocyte infiltration in COX-2-M/-M and COX-2+/+ mice. MPO enzymatic activity (panel A) was statistically similar in COX-2-M/-M and COX-2+/+ livers at 6 h and 24 h post-IRI. Ly-6G+ neutrophil (panel B) and granulocyte (panel C) infiltration were also comparable in COX-2-M/-M and COX-2+/+ livers after IRI. Mac-1+ (panel D) and CD68 (panel E) infiltrating macrophages were significantly reduced in COX-2-M/-M livers at 24 h post-reperfusion, but were statistically indistinguishable in COX-2-M/-M and COX-2+/+ livers at 6 h after IRI. No statistical differences in MMP-9 expression (panel F) could be demonstrated in livers of COX-2-M/-M and COX-2+/+ mice post-IRI. Representative immunostaining (panel G) of infiltrating Ly-6G+ (a,b,e,f) and Mac-1+ (c,d,g,h) leukocytes in livers of COX-2+/+ (a,c,e,g) and COX-2-M/-M (b,d,f,h) mice at 6 h (a to d) and 24 h (e to h) post IRI; (n = 5 -6/group; * indicates p)
CD68, Monoclonal Antibody (Cat# AAA12106)
Full Name
RAT ANTI MOUSE CD68:FITC
Gene Names
Cd68; Lamp4; gp110; Scard1
Applications
FC/FACS
Pricing


 Application Data
(Published customer image: Leukocyte infiltration in COX-2-M/-M and COX-2+/+ mice. MPO enzymatic activity (panel A) was statistically similar in COX-2-M/-M and COX-2+/+ livers at 6 h and 24 h post-IRI. Ly-6G+ neutrophil (panel B) and granulocyte (panel C) infiltration were also comparable in COX-2-M/-M and COX-2+/+ livers after IRI. Mac-1+ (panel D) and CD68 (panel E) infiltrating macrophages were significantly reduced in COX-2-M/-M livers at 24 h post-reperfusion, but were statistically indistinguishable in COX-2-M/-M and COX-2+/+ livers at 6 h after IRI. No statistical differences in MMP-9 expression (panel F) could be demonstrated in livers of COX-2-M/-M and COX-2+/+ mice post-IRI. Representative immunostaining (panel G) of infiltrating Ly-6G+ (a,b,e,f) and Mac-1+ (c,d,g,h) leukocytes in livers of COX-2+/+ (a,c,e,g) and COX-2-M/-M (b,d,f,h) mice at 6 h (a to d) and 24 h (e to h) post IRI; (n = 5 -6/group; * indicates p)
Application Data
(Published customer image: Leukocyte infiltration in COX-2-M/-M and COX-2+/+ mice. MPO enzymatic activity (panel A) was statistically similar in COX-2-M/-M and COX-2+/+ livers at 6 h and 24 h post-IRI. Ly-6G+ neutrophil (panel B) and granulocyte (panel C) infiltration were also comparable in COX-2-M/-M and COX-2+/+ livers after IRI. Mac-1+ (panel D) and CD68 (panel E) infiltrating macrophages were significantly reduced in COX-2-M/-M livers at 24 h post-reperfusion, but were statistically indistinguishable in COX-2-M/-M and COX-2+/+ livers at 6 h after IRI. No statistical differences in MMP-9 expression (panel F) could be demonstrated in livers of COX-2-M/-M and COX-2+/+ mice post-IRI. Representative immunostaining (panel G) of infiltrating Ly-6G+ (a,b,e,f) and Mac-1+ (c,d,g,h) leukocytes in livers of COX-2+/+ (a,c,e,g) and COX-2-M/-M (b,d,f,h) mice at 6 h (a to d) and 24 h (e to h) post IRI; (n = 5 -6/group; * indicates p)
CD68, Monoclonal Antibody (Cat# AAA12103)
Full Name
RAT ANTI MOUSE CD68:Biotin
Gene Names
Cd68; Lamp4; gp110; Scard1
Applications
FC/FACS
Pricing


 Application Data
(Published customer image: Leukocyte infiltration in COX-2-M/-M and COX-2+/+ mice. MPO enzymatic activity (panel A) was statistically similar in COX-2-M/-M and COX-2+/+ livers at 6 h and 24 h post-IRI. Ly-6G+ neutrophil (panel B) and granulocyte (panel C) infiltration were also comparable in COX-2-M/-M and COX-2+/+ livers after IRI. Mac-1+ (panel D) and CD68 (panel E) infiltrating macrophages were significantly reduced in COX-2-M/-M livers at 24 h post-reperfusion, but were statistically indistinguishable in COX-2-M/-M and COX-2+/+ livers at 6 h after IRI. No statistical differences in MMP-9 expression (panel F) could be demonstrated in livers of COX-2-M/-M and COX-2+/+ mice post-IRI. Representative immunostaining (panel G) of infiltrating Ly-6G+ (a,b,e,f) and Mac-1+ (c,d,g,h) leukocytes in livers of COX-2+/+ (a,c,e,g) and COX-2-M/-M (b,d,f,h) mice at 6 h (a to d) and 24 h (e to h) post IRI; (n = 5 -6/group; * indicates p)
Application Data
(Published customer image: Leukocyte infiltration in COX-2-M/-M and COX-2+/+ mice. MPO enzymatic activity (panel A) was statistically similar in COX-2-M/-M and COX-2+/+ livers at 6 h and 24 h post-IRI. Ly-6G+ neutrophil (panel B) and granulocyte (panel C) infiltration were also comparable in COX-2-M/-M and COX-2+/+ livers after IRI. Mac-1+ (panel D) and CD68 (panel E) infiltrating macrophages were significantly reduced in COX-2-M/-M livers at 24 h post-reperfusion, but were statistically indistinguishable in COX-2-M/-M and COX-2+/+ livers at 6 h after IRI. No statistical differences in MMP-9 expression (panel F) could be demonstrated in livers of COX-2-M/-M and COX-2+/+ mice post-IRI. Representative immunostaining (panel G) of infiltrating Ly-6G+ (a,b,e,f) and Mac-1+ (c,d,g,h) leukocytes in livers of COX-2+/+ (a,c,e,g) and COX-2-M/-M (b,d,f,h) mice at 6 h (a to d) and 24 h (e to h) post IRI; (n = 5 -6/group; * indicates p)
CD68, Monoclonal Antibody (Cat# AAA12107)
Full Name
RAT ANTI MOUSE CD68
Gene Names
Cd68; Lamp4; gp110; Scard1
Applications
FC/FACS, IF, IP, WB
Purity
Purified
Purified IgG - liquid
Purified IgG - liquid
Pricing


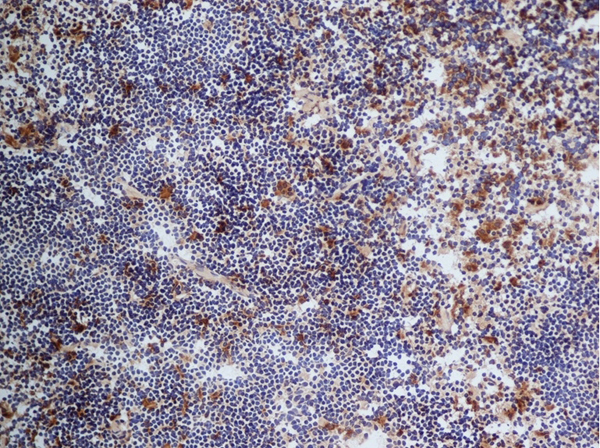
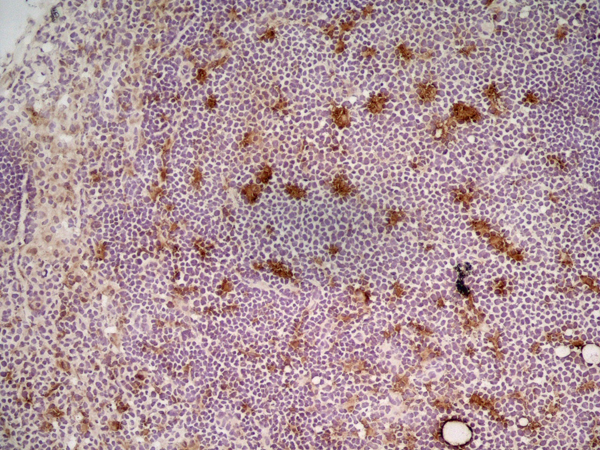
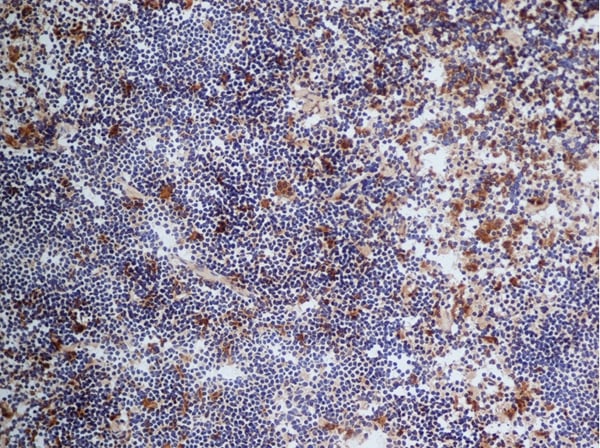
 IHC (Immunohistchemistry)
(At 1/200 staining Human breast tissue sections by IHC-P. The tissue was formaldehyde fixed and a heat mediated antigen retrieval step in citrate buffer was performed. The tissue was then blocked and incubated with the antibody for 1.5 hours at 22 degree C. An HRP conjugated goat anti-rabbit antibody was used as the secondary antibody.)
IHC (Immunohistchemistry)
(At 1/200 staining Human breast tissue sections by IHC-P. The tissue was formaldehyde fixed and a heat mediated antigen retrieval step in citrate buffer was performed. The tissue was then blocked and incubated with the antibody for 1.5 hours at 22 degree C. An HRP conjugated goat anti-rabbit antibody was used as the secondary antibody.)
KAT3B/p300, Polyclonal Antibody (Cat# AAA31393)
Full Name
Phospho-KAT3B/p300 (Ser1834) Antibody
Gene Names
EP300; p300; KAT3B; RSTS2
Reactivity
Human, Mouse, Rat
Predicted Reactivity: Pig (100%), Bovine (100%), Horse (100%), Sheep (100%), Rabbit (100%), Chicken (100%), Xenopus (100%)
Predicted Reactivity: Pig (100%), Bovine (100%), Horse (100%), Sheep (100%), Rabbit (100%), Chicken (100%), Xenopus (100%)
Applications
WB, IHC, EIA
Purity
The antibody is from purified rabbit serum by affinity purification via sequential chromatography on phospho-peptide and non-phospho-peptide affinity columns.
Pricing


 Application Data
(Published customer image: Leukocyte infiltration in COX-2-M/-M and COX-2+/+ mice. MPO enzymatic activity (panel A) was statistically similar in COX-2-M/-M and COX-2+/+ livers at 6 h and 24 h post-IRI. Ly-6G+ neutrophil (panel B) and granulocyte (panel C) infiltration were also comparable in COX-2-M/-M and COX-2+/+ livers after IRI. Mac-1+ (panel D) and CD68 (panel E) infiltrating macrophages were significantly reduced in COX-2-M/-M livers at 24 h post-reperfusion, but were statistically indistinguishable in COX-2-M/-M and COX-2+/+ livers at 6 h after IRI. No statistical differences in MMP-9 expression (panel F) could be demonstrated in livers of COX-2-M/-M and COX-2+/+ mice post-IRI. Representative immunostaining (panel G) of infiltrating Ly-6G+ (a,b,e,f) and Mac-1+ (c,d,g,h) leukocytes in livers of COX-2+/+ (a,c,e,g) and COX-2-M/-M (b,d,f,h) mice at 6 h (a to d) and 24 h (e to h) post IRI; (n = 5 -6/group; * indicates p)
Application Data
(Published customer image: Leukocyte infiltration in COX-2-M/-M and COX-2+/+ mice. MPO enzymatic activity (panel A) was statistically similar in COX-2-M/-M and COX-2+/+ livers at 6 h and 24 h post-IRI. Ly-6G+ neutrophil (panel B) and granulocyte (panel C) infiltration were also comparable in COX-2-M/-M and COX-2+/+ livers after IRI. Mac-1+ (panel D) and CD68 (panel E) infiltrating macrophages were significantly reduced in COX-2-M/-M livers at 24 h post-reperfusion, but were statistically indistinguishable in COX-2-M/-M and COX-2+/+ livers at 6 h after IRI. No statistical differences in MMP-9 expression (panel F) could be demonstrated in livers of COX-2-M/-M and COX-2+/+ mice post-IRI. Representative immunostaining (panel G) of infiltrating Ly-6G+ (a,b,e,f) and Mac-1+ (c,d,g,h) leukocytes in livers of COX-2+/+ (a,c,e,g) and COX-2-M/-M (b,d,f,h) mice at 6 h (a to d) and 24 h (e to h) post IRI; (n = 5 -6/group; * indicates p)
CD68, Monoclonal Antibody (Cat# AAA12110)
Full Name
RAT ANTI MOUSE CD68
Gene Names
Cd68; Lamp4; gp110; Scard1
Applications
FC, IA, IF, IP, WB
Pricing


 Application Data
(Published customer image Infiltration of GFP+ BM-cells in infarct and peri-infarct regions. (A-B) Dot plots of viable macrophages/granulocytes (CD11b+CD45high, top right quadrants) and microglia (CD11b+CD45dim, bottom right quadrants) in cortex from BM-chimeric unmanipulated mice and mice exposed to pMCAO. (C) Bar graph showing mean numbers of CD11b+CD45dim microglia and CD11b+CD45high macrophages/granulocytes in BM-chimeric mice 24 hours after pMCAO, subdivided based on expression of GFP (n = 5). Approximately 92% of of the CD45high population were GFP+. (D) Estimation and comparison of mean numbers of CD11b+CD45dim microglia in non-chimeric (n = 10) versus BM-chimeric mice (n = 5) 24 hours after of pMCAO shows significantly fewer CD11b+CD45dim microglial cells in irradiated mice. (E) Overview, showing distribution of infiltrating GFP+ BM-derived cells into infarct (IF) and peri-infarct (P-IF) regions 24 hours after pMCAO. (E-G) By 24 hours, GFP+ single cells (F) and vessel-associated aggregates of GFP+ cells (arrows in G) were observed in infarct and peri-infarct regions. Some of the vessel-associated cells were round, leukocyte-like cells (arrows) while others were elongated cells lining the vasculature (arrow heads in G and in insert). (H) Bar graph showing mean numbers of single GFP+ cells and vessel-associated aggregates of GFP+ cells in ipsi- and contralateral cortex 24 hours after surgery (n = 10). (I-P) Immunohistochemical staining of CD45.1 (I, K), CD45.2 (J, L), IgG2a (M, O) and CD45 (N, P) in ischemic tissue in BM-chimeric (I, J, M, N) and non-chimeric mice (K, L, O, P) 24 hours after pMCAO. N.D, none detected. Scale bars: 200 um (A), 10 um (B, C). 50 um (I-P) *P < 0.05, **P < 0.01, and ***P < 0.001.From: Clausen BH, Lambertsen KL, Babcock AA, Holm TH, Dagnaes-Hansen F, Finsen B. Interleukin-1beta and tumor necrosis factor-alpha are expressed by different subsets of microglia and macrophages after ischemic stroke in mice. J Neuroinflammation. 2008 Oct 23;5:46.)
Application Data
(Published customer image Infiltration of GFP+ BM-cells in infarct and peri-infarct regions. (A-B) Dot plots of viable macrophages/granulocytes (CD11b+CD45high, top right quadrants) and microglia (CD11b+CD45dim, bottom right quadrants) in cortex from BM-chimeric unmanipulated mice and mice exposed to pMCAO. (C) Bar graph showing mean numbers of CD11b+CD45dim microglia and CD11b+CD45high macrophages/granulocytes in BM-chimeric mice 24 hours after pMCAO, subdivided based on expression of GFP (n = 5). Approximately 92% of of the CD45high population were GFP+. (D) Estimation and comparison of mean numbers of CD11b+CD45dim microglia in non-chimeric (n = 10) versus BM-chimeric mice (n = 5) 24 hours after of pMCAO shows significantly fewer CD11b+CD45dim microglial cells in irradiated mice. (E) Overview, showing distribution of infiltrating GFP+ BM-derived cells into infarct (IF) and peri-infarct (P-IF) regions 24 hours after pMCAO. (E-G) By 24 hours, GFP+ single cells (F) and vessel-associated aggregates of GFP+ cells (arrows in G) were observed in infarct and peri-infarct regions. Some of the vessel-associated cells were round, leukocyte-like cells (arrows) while others were elongated cells lining the vasculature (arrow heads in G and in insert). (H) Bar graph showing mean numbers of single GFP+ cells and vessel-associated aggregates of GFP+ cells in ipsi- and contralateral cortex 24 hours after surgery (n = 10). (I-P) Immunohistochemical staining of CD45.1 (I, K), CD45.2 (J, L), IgG2a (M, O) and CD45 (N, P) in ischemic tissue in BM-chimeric (I, J, M, N) and non-chimeric mice (K, L, O, P) 24 hours after pMCAO. N.D, none detected. Scale bars: 200 um (A), 10 um (B, C). 50 um (I-P) *P < 0.05, **P < 0.01, and ***P < 0.001.From: Clausen BH, Lambertsen KL, Babcock AA, Holm TH, Dagnaes-Hansen F, Finsen B. Interleukin-1beta and tumor necrosis factor-alpha are expressed by different subsets of microglia and macrophages after ischemic stroke in mice. J Neuroinflammation. 2008 Oct 23;5:46.)
CD11b, Monoclonal Antibody (Cat# AAA12182)
Full Name
RAT ANTI MOUSE CD11b:FITC
Gene Names
Itgam; CR3; CR3A; MAC1; Cd11b; Ly-40; Mac-1; Mac-1a; CD11b/CD18; F730045J24Rik
Applications
FC/FACS
Pricing


 Application Data
(Published customer image Infiltration of GFP+ BM-cells in infarct and peri-infarct regions. (A-B) Dot plots of viable macrophages/granulocytes (CD11b+CD45high, top right quadrants) and microglia (CD11b+CD45dim, bottom right quadrants) in cortex from BM-chimeric unmanipulated mice and mice exposed to pMCAO. (C) Bar graph showing mean numbers of CD11b+CD45dim microglia and CD11b+CD45high macrophages/granulocytes in BM-chimeric mice 24 hours after pMCAO, subdivided based on expression of GFP (n = 5). Approximately 92% of of the CD45high population were GFP+. (D) Estimation and comparison of mean numbers of CD11b+CD45dim microglia in non-chimeric (n = 10) versus BM-chimeric mice (n = 5) 24 hours after of pMCAO shows significantly fewer CD11b+CD45dim microglial cells in irradiated mice. (E) Overview, showing distribution of infiltrating GFP+ BM-derived cells into infarct (IF) and peri-infarct (P-IF) regions 24 hours after pMCAO. (E-G) By 24 hours, GFP+ single cells (F) and vessel-associated aggregates of GFP+ cells (arrows in G) were observed in infarct and peri-infarct regions. Some of the vessel-associated cells were round, leukocyte-like cells (arrows) while others were elongated cells lining the vasculature (arrow heads in G and in insert). (H) Bar graph showing mean numbers of single GFP+ cells and vessel-associated aggregates of GFP+ cells in ipsi- and contralateral cortex 24 hours after surgery (n = 10). (I-P) Immunohistochemical staining of CD45.1 (I, K), CD45.2 (J, L), IgG2a (M, O) and CD45 (N, P) in ischemic tissue in BM-chimeric (I, J, M, N) and non-chimeric mice (K, L, O, P) 24 hours after pMCAO. N.D, none detected. Scale bars: 200 um (A), 10 um (B, C). 50 um (I-P) *P < 0.05, **P < 0.01, and ***P < 0.001.From: Clausen BH, Lambertsen KL, Babcock AA, Holm TH, Dagnaes-Hansen F, Finsen B. Interleukin-1beta and tumor necrosis factor-alpha are expressed by different subsets of microglia and macrophages after ischemic stroke in mice. J Neuroinflammation. 2008 Oct 23;5:46.)
Application Data
(Published customer image Infiltration of GFP+ BM-cells in infarct and peri-infarct regions. (A-B) Dot plots of viable macrophages/granulocytes (CD11b+CD45high, top right quadrants) and microglia (CD11b+CD45dim, bottom right quadrants) in cortex from BM-chimeric unmanipulated mice and mice exposed to pMCAO. (C) Bar graph showing mean numbers of CD11b+CD45dim microglia and CD11b+CD45high macrophages/granulocytes in BM-chimeric mice 24 hours after pMCAO, subdivided based on expression of GFP (n = 5). Approximately 92% of of the CD45high population were GFP+. (D) Estimation and comparison of mean numbers of CD11b+CD45dim microglia in non-chimeric (n = 10) versus BM-chimeric mice (n = 5) 24 hours after of pMCAO shows significantly fewer CD11b+CD45dim microglial cells in irradiated mice. (E) Overview, showing distribution of infiltrating GFP+ BM-derived cells into infarct (IF) and peri-infarct (P-IF) regions 24 hours after pMCAO. (E-G) By 24 hours, GFP+ single cells (F) and vessel-associated aggregates of GFP+ cells (arrows in G) were observed in infarct and peri-infarct regions. Some of the vessel-associated cells were round, leukocyte-like cells (arrows) while others were elongated cells lining the vasculature (arrow heads in G and in insert). (H) Bar graph showing mean numbers of single GFP+ cells and vessel-associated aggregates of GFP+ cells in ipsi- and contralateral cortex 24 hours after surgery (n = 10). (I-P) Immunohistochemical staining of CD45.1 (I, K), CD45.2 (J, L), IgG2a (M, O) and CD45 (N, P) in ischemic tissue in BM-chimeric (I, J, M, N) and non-chimeric mice (K, L, O, P) 24 hours after pMCAO. N.D, none detected. Scale bars: 200 um (A), 10 um (B, C). 50 um (I-P) *P < 0.05, **P < 0.01, and ***P < 0.001.From: Clausen BH, Lambertsen KL, Babcock AA, Holm TH, Dagnaes-Hansen F, Finsen B. Interleukin-1beta and tumor necrosis factor-alpha are expressed by different subsets of microglia and macrophages after ischemic stroke in mice. J Neuroinflammation. 2008 Oct 23;5:46.)
CD11b, Monoclonal Antibody (Cat# AAA12183)
Full Name
RAT ANTI MOUSE CD11b:FITC
Gene Names
Itgam; CR3; CR3A; MAC1; Cd11b; Ly-40; Mac-1; Mac-1a; CD11b/CD18; F730045J24Rik
Applications
FC/FACS
Pricing


 Application Data
(Published customer image Infiltration of GFP+ BM-cells in infarct and peri-infarct regions. (A-B) Dot plots of viable macrophages/granulocytes (CD11b+CD45high, top right quadrants) and microglia (CD11b+CD45dim, bottom right quadrants) in cortex from BM-chimeric unmanipulated mice and mice exposed to pMCAO. (C) Bar graph showing mean numbers of CD11b+CD45dim microglia and CD11b+CD45high macrophages/granulocytes in BM-chimeric mice 24 hours after pMCAO, subdivided based on expression of GFP (n = 5). Approximately 92% of of the CD45high population were GFP+. (D) Estimation and comparison of mean numbers of CD11b+CD45dim microglia in non-chimeric (n = 10) versus BM-chimeric mice (n = 5) 24 hours after of pMCAO shows significantly fewer CD11b+CD45dim microglial cells in irradiated mice. (E) Overview, showing distribution of infiltrating GFP+ BM-derived cells into infarct (IF) and peri-infarct (P-IF) regions 24 hours after pMCAO. (E-G) By 24 hours, GFP+ single cells (F) and vessel-associated aggregates of GFP+ cells (arrows in G) were observed in infarct and peri-infarct regions. Some of the vessel-associated cells were round, leukocyte-like cells (arrows) while others were elongated cells lining the vasculature (arrow heads in G and in insert). (H) Bar graph showing mean numbers of single GFP+ cells and vessel-associated aggregates of GFP+ cells in ipsi- and contralateral cortex 24 hours after surgery (n = 10). (I-P) Immunohistochemical staining of CD45.1 (I, K), CD45.2 (J, L), IgG2a (M, O) and CD45 (N, P) in ischemic tissue in BM-chimeric (I, J, M, N) and non-chimeric mice (K, L, O, P) 24 hours after pMCAO. N.D, none detected. Scale bars: 200 um (A), 10 um (B, C). 50 um (I-P) *P < 0.05, **P < 0.01, and ***P < 0.001.From: Clausen BH, Lambertsen KL, Babcock AA, Holm TH, Dagnaes-Hansen F, Finsen B. Interleukin-1beta and tumor necrosis factor-alpha are expressed by different subsets of microglia and macrophages after ischemic stroke in mice. J Neuroinflammation. 2008 Oct 23;5:46.)
Application Data
(Published customer image Infiltration of GFP+ BM-cells in infarct and peri-infarct regions. (A-B) Dot plots of viable macrophages/granulocytes (CD11b+CD45high, top right quadrants) and microglia (CD11b+CD45dim, bottom right quadrants) in cortex from BM-chimeric unmanipulated mice and mice exposed to pMCAO. (C) Bar graph showing mean numbers of CD11b+CD45dim microglia and CD11b+CD45high macrophages/granulocytes in BM-chimeric mice 24 hours after pMCAO, subdivided based on expression of GFP (n = 5). Approximately 92% of of the CD45high population were GFP+. (D) Estimation and comparison of mean numbers of CD11b+CD45dim microglia in non-chimeric (n = 10) versus BM-chimeric mice (n = 5) 24 hours after of pMCAO shows significantly fewer CD11b+CD45dim microglial cells in irradiated mice. (E) Overview, showing distribution of infiltrating GFP+ BM-derived cells into infarct (IF) and peri-infarct (P-IF) regions 24 hours after pMCAO. (E-G) By 24 hours, GFP+ single cells (F) and vessel-associated aggregates of GFP+ cells (arrows in G) were observed in infarct and peri-infarct regions. Some of the vessel-associated cells were round, leukocyte-like cells (arrows) while others were elongated cells lining the vasculature (arrow heads in G and in insert). (H) Bar graph showing mean numbers of single GFP+ cells and vessel-associated aggregates of GFP+ cells in ipsi- and contralateral cortex 24 hours after surgery (n = 10). (I-P) Immunohistochemical staining of CD45.1 (I, K), CD45.2 (J, L), IgG2a (M, O) and CD45 (N, P) in ischemic tissue in BM-chimeric (I, J, M, N) and non-chimeric mice (K, L, O, P) 24 hours after pMCAO. N.D, none detected. Scale bars: 200 um (A), 10 um (B, C). 50 um (I-P) *P < 0.05, **P < 0.01, and ***P < 0.001.From: Clausen BH, Lambertsen KL, Babcock AA, Holm TH, Dagnaes-Hansen F, Finsen B. Interleukin-1beta and tumor necrosis factor-alpha are expressed by different subsets of microglia and macrophages after ischemic stroke in mice. J Neuroinflammation. 2008 Oct 23;5:46.)
CD11b, Monoclonal Antibody (Cat# AAA12186)
Full Name
RAT ANTI MOUSE CD11b:RPE
Gene Names
Itgam; CR3; CR3A; MAC1; Cd11b; Ly-40; Mac-1; Mac-1a; CD11b/CD18; F730045J24Rik
Applications
FC/FACS
Pricing