Filters
Clonality
Type
Reactivity
Gene Name
Isotype
Host
Application
Clone
289 results for "Flow Cytometry Antibodies" - showing 250-289


 IF (Immunofluorescence)
(Fluorescent confocal image of Hela cell stained with XRCC6 Antibody (C-term). Hela cells were fixed with 4% PFA (20 min), permeabilized with Triton X-100 (0.1%, 10 min), then incubated with XRCC6 primary antibody (1:25, 1 h at 37 degree). For secondary antibody, Alexa Fluor 488 conjugated donkey anti-rabbit antibody (green) was used (1:400, 50 min at 37 degree).Cytoplasmic actin was counterstained with Alexa Fluor 555 (red) conjugated Phalloidin (7units/ml, 1 h at 37 degree). Nuclei were counterstained with DAPI (blue) (10 ug/ml, 10 min). XRCC6 immunoreactivity is localized to nucleus significantly and Cytoplasm weakly.)
IF (Immunofluorescence)
(Fluorescent confocal image of Hela cell stained with XRCC6 Antibody (C-term). Hela cells were fixed with 4% PFA (20 min), permeabilized with Triton X-100 (0.1%, 10 min), then incubated with XRCC6 primary antibody (1:25, 1 h at 37 degree). For secondary antibody, Alexa Fluor 488 conjugated donkey anti-rabbit antibody (green) was used (1:400, 50 min at 37 degree).Cytoplasmic actin was counterstained with Alexa Fluor 555 (red) conjugated Phalloidin (7units/ml, 1 h at 37 degree). Nuclei were counterstained with DAPI (blue) (10 ug/ml, 10 min). XRCC6 immunoreactivity is localized to nucleus significantly and Cytoplasm weakly.)
XRCC6, Polyclonal Antibody (Cat# AAA28768)
Full Name
XRCC6 Antibody (C-term)
Gene Names
XRCC6; ML8; KU70; TLAA; CTC75; CTCBF; G22P1
Reactivity
Human
Applications
WB, EIA, IHC, FC/FACS, IF
Purity
Peptide Affinity Purified Rabbit Polyclonal Antibody (Pab)
Pricing


 FCM (Flow Cytometry)
(GTF2I Antibody (C-term) flow cytometric analysis of k562 cells (bottom histogram) compared to a negative control cell (top histogram).FITC-conjugated goat-anti-rabbit secondary antibodies were used for the analysis.)
FCM (Flow Cytometry)
(GTF2I Antibody (C-term) flow cytometric analysis of k562 cells (bottom histogram) compared to a negative control cell (top histogram).FITC-conjugated goat-anti-rabbit secondary antibodies were used for the analysis.)
GTF2I, Polyclonal Antibody (Cat# AAA28707)
Full Name
GTF2I Antibody (C-term)
Gene Names
GTF2I; WBS; DIWS; SPIN; IB291; BAP135; BTKAP1; TFII-I; WBSCR6; GTFII-I
Reactivity
Human (Predicted Reactivity: Rat)
Applications
IF, EIA, IHC, FC/FACS, WB
Purity
Peptide Affinity Purified Rabbit Polyclonal Antibody (Pab)
Pricing


 Application Data
(Staining of mouse spleen with Rat anti Mouse CD4:RPE)
Application Data
(Staining of mouse spleen with Rat anti Mouse CD4:RPE)
CD4, Monoclonal Antibody (Cat# AAA12228)
Full Name
RAT ANTI MOUSE CD4:FITC
Gene Names
Cd4; L3T4; Ly-4
Applications
FC/FACS
Pricing


 Application Data
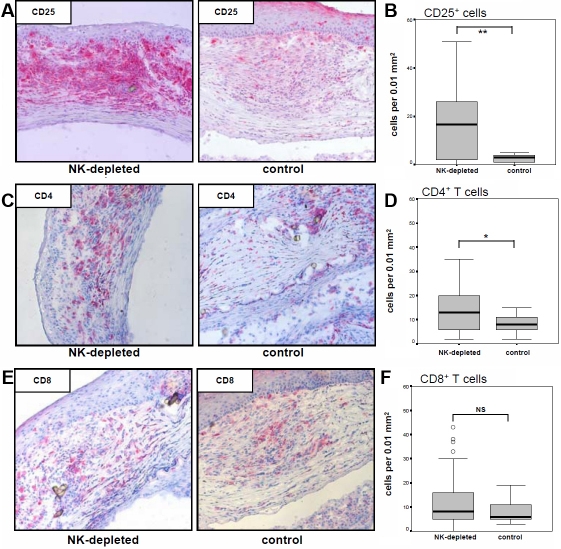
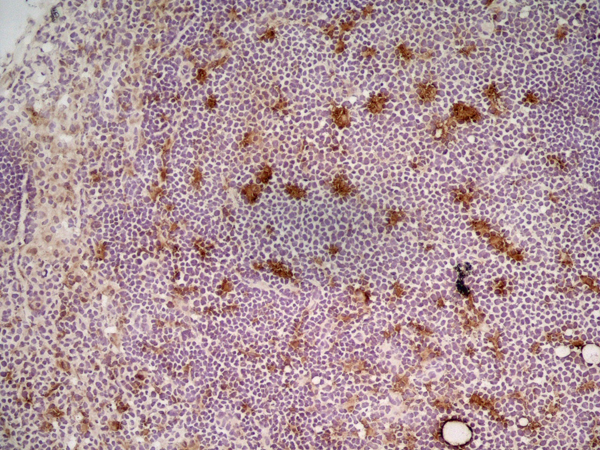
(Immunoperoxidase staining of rat lymph node cryosection with Mouse anti Rat CD25 followed by horseradish peroxidase conjugated Goat anti Mouse IgG1 as a detection reagent. High power)
Application Data
(Immunoperoxidase staining of rat lymph node cryosection with Mouse anti Rat CD25 followed by horseradish peroxidase conjugated Goat anti Mouse IgG1 as a detection reagent. High power)
CD25, Monoclonal Antibody (Cat# AAA12044)
Full Name
MOUSE ANTI RAT CD25:RPE
Gene Names
Il2ra; IL2RAC
Applications
FC/FACS
Pricing


 FCM (Flow Cytometry)
(Overlay Peak curve showing Hela cells stained with AAA28066 (red line) at 1:200. The cells were fixed in 4% formaldehyde and permeated by 0.2% TritonX-100. Then 10% normal goat serum was Incubated to block non-specific protein-protein interactions followed by the antibody (1?g/1*106cells) for 1 h at 4 degree C. The secondary antibody used was FITC-conjugated Goat Anti-Mouse IgG(H+L) at 1/100 dilution for 30min at 4 degree C. Isotype control antibody (green line) was mouse IgG2b (1?g/1*106cells) used under the same conditions. Acquisition of >10,000 events was performed.)
FCM (Flow Cytometry)
(Overlay Peak curve showing Hela cells stained with AAA28066 (red line) at 1:200. The cells were fixed in 4% formaldehyde and permeated by 0.2% TritonX-100. Then 10% normal goat serum was Incubated to block non-specific protein-protein interactions followed by the antibody (1?g/1*106cells) for 1 h at 4 degree C. The secondary antibody used was FITC-conjugated Goat Anti-Mouse IgG(H+L) at 1/100 dilution for 30min at 4 degree C. Isotype control antibody (green line) was mouse IgG2b (1?g/1*106cells) used under the same conditions. Acquisition of >10,000 events was performed.)
ACTB, Monoclonal Antibody (Cat# AAA28066)
Full Name
ACTB Monoclonal Antibody
Reactivity
Human, Mouse, Rat, Rabbit
Applications
EIA, WB, IHC, IF, FC/FACS, IP
Purity
>95%, Protein A purified
Pricing


 Application Data
(Published clone specific image: Flow cytometric analysis of AM from NO2-exposed and control rats. Rats were exposed to NO2 for the indicated times and BAL cells were stained with antibodies to ED7, ED9, RM-4, and OX-6. To overcome autofluorescence signals, primary antibodies were detected using a biotin-PE/streptavidin-anti-streptavidin enhancing system and labeling of AM was analyzed by flow cytometry following gating by help of forward and sideward scatter properties. Shown are representative results of at least six animals per group.From: Garn H, Siese A, Stumpf S, Wensing A, Renz H, Gemsa D. Phenotypical and functional characterization of alveolar macrophage subpopulations in the lungs of NO2-exposed rats. Respir Res. 2006 Jan 6;7:4.)
Application Data
(Published clone specific image: Flow cytometric analysis of AM from NO2-exposed and control rats. Rats were exposed to NO2 for the indicated times and BAL cells were stained with antibodies to ED7, ED9, RM-4, and OX-6. To overcome autofluorescence signals, primary antibodies were detected using a biotin-PE/streptavidin-anti-streptavidin enhancing system and labeling of AM was analyzed by flow cytometry following gating by help of forward and sideward scatter properties. Shown are representative results of at least six animals per group.From: Garn H, Siese A, Stumpf S, Wensing A, Renz H, Gemsa D. Phenotypical and functional characterization of alveolar macrophage subpopulations in the lungs of NO2-exposed rats. Respir Res. 2006 Jan 6;7:4.)
CD172a, Monoclonal Antibody (Cat# AAA11888)
Full Name
MOUSE ANTI RAT CD172a:FITC
Gene Names
Sirpa; Bit; Ptpns1; SHPS-1
Applications
FC/FACS
Pricing


 Application Data
(Published clone specific image: Flow cytometric analysis of AM from NO2-exposed and control rats. Rats were exposed to NO2 for the indicated times and BAL cells were stained with antibodies to ED7, ED9, RM-4, and OX-6. To overcome autofluorescence signals, primary antibodies were detected using a biotin-PE/streptavidin-anti-streptavidin enhancing system and labeling of AM was analyzed by flow cytometry following gating by help of forward and sideward scatter properties. Shown are representative results of at least six animals per group.From: Garn H, Siese A, Stumpf S, Wensing A, Renz H, Gemsa D. Phenotypical and functional characterization of alveolar macrophage subpopulations in the lungs of NO2-exposed rats. Respir Res. 2006 Jan 6;7:4.)
Application Data
(Published clone specific image: Flow cytometric analysis of AM from NO2-exposed and control rats. Rats were exposed to NO2 for the indicated times and BAL cells were stained with antibodies to ED7, ED9, RM-4, and OX-6. To overcome autofluorescence signals, primary antibodies were detected using a biotin-PE/streptavidin-anti-streptavidin enhancing system and labeling of AM was analyzed by flow cytometry following gating by help of forward and sideward scatter properties. Shown are representative results of at least six animals per group.From: Garn H, Siese A, Stumpf S, Wensing A, Renz H, Gemsa D. Phenotypical and functional characterization of alveolar macrophage subpopulations in the lungs of NO2-exposed rats. Respir Res. 2006 Jan 6;7:4.)
CD172a, Monoclonal Antibody (Cat# AAA12056)
Full Name
MOUSE ANTI RAT CD172a:RPE
Gene Names
Sirpa; Bit; Ptpns1; SHPS-1
Applications
FC/FACS
Pricing


 Application Data
(Staining of KG1 lymphocytes with Mouse anti Human CD59:FITC)
Application Data
(Staining of KG1 lymphocytes with Mouse anti Human CD59:FITC)
CD59, Monoclonal Antibody (Cat# AAA11916)
Full Name
MOUSE ANTI HUMAN CD59
Gene Names
CD59; 1F5; EJ16; EJ30; EL32; G344; MIN1; MIN2; MIN3; MIRL; HRF20; MACIF; MEM43; MIC11; MSK21; 16.3A5; HRF-20; MAC-IP; p18-20
Applications
EIA, EM, FC/FACS, IF, IP, WB
Pricing


 Application Data
(Staining of KG1 lymphocytes with Mouse anti Human CD59:FITC)
Application Data
(Staining of KG1 lymphocytes with Mouse anti Human CD59:FITC)
CD59, Monoclonal Antibody (Cat# AAA11917)
Full Name
MOUSE ANTI HUMAN CD59
Gene Names
CD59; 1F5; EJ16; EJ30; EL32; G344; MIN1; MIN2; MIN3; MIRL; HRF20; MACIF; MEM43; MIC11; MSK21; 16.3A5; HRF-20; MAC-IP; p18-20
Applications
EIA, EM, FC/FACS, IF, IP, WB
Pricing


 IP (Immunoprecipitation)
(Immunoprecipitating GFP in 293F whole cell lysate transfected with GFPLane 1: Mouse control IgG2b instead of AAA28064 in 293F whole cell lysate transfected with GFPLane 2: AAA28064 (4ug) + 293F whole cell lysate transfected with GFP (500ug)Lane 3: 293F whole cell lysate transfected with GFP (5ug)For western blotting, the blot was detected with AAA28064 at 1:2000, and a HRP-conjugated Protein G antibody was used as the secondary antibody at 1:50000)
IP (Immunoprecipitation)
(Immunoprecipitating GFP in 293F whole cell lysate transfected with GFPLane 1: Mouse control IgG2b instead of AAA28064 in 293F whole cell lysate transfected with GFPLane 2: AAA28064 (4ug) + 293F whole cell lysate transfected with GFP (500ug)Lane 3: 293F whole cell lysate transfected with GFP (5ug)For western blotting, the blot was detected with AAA28064 at 1:2000, and a HRP-conjugated Protein G antibody was used as the secondary antibody at 1:50000)
GFP, Monoclonal Antibody (Cat# AAA28064)
Full Name
GFP Monoclonal Antibody
Reactivity
All
Applications
EIA, WB, IF, FC/FACS, IP
Purity
>95%,Protein G purified
Pricing


 Application Data
(Immunoperoxidase staining of rat lymph node cryosection with Mouse anti Rat CD25 followed by horseradish peroxidase conjugated Goat anti Mouse IgG1 as a detection reagent. High power)
Application Data
(Immunoperoxidase staining of rat lymph node cryosection with Mouse anti Rat CD25 followed by horseradish peroxidase conjugated Goat anti Mouse IgG1 as a detection reagent. High power)
CD25, Monoclonal Antibody (Cat# AAA11966)
Full Name
MOUSE ANTI RAT CD25
Gene Names
Il2ra; IL2RAC
Applications
EIA, FC/FACS, IP
Pricing


 IHC (Immunohistochemistry)
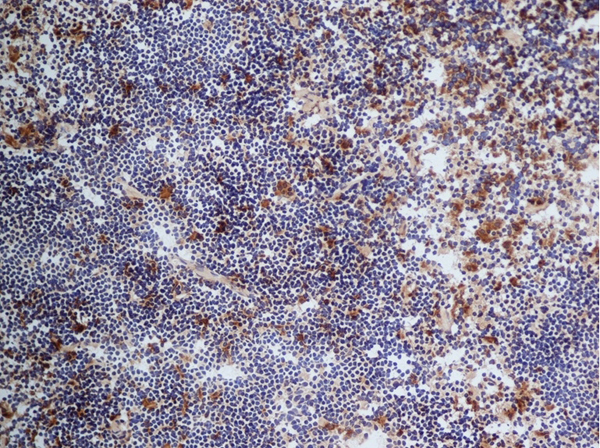
(Immunohistochemical analysis of paraffin-embedded Human brain section using Pink 1 (AAA28759). AAA28759 was diluted at 1:1000 dilution. A undiluted binotinylated goat polyvalent antibody was used as the secondary, followed by DAB staining)
IHC (Immunohistochemistry)
(Immunohistochemical analysis of paraffin-embedded Human brain section using Pink 1 (AAA28759). AAA28759 was diluted at 1:1000 dilution. A undiluted binotinylated goat polyvalent antibody was used as the secondary, followed by DAB staining)
S100B, Polyclonal Antibody (Cat# AAA28759)
Full Name
S100B Antibody
Gene Names
S100B; NEF; S100; S100-B; S100beta
Reactivity
Human, Mouse, Rat (Predicted: Rabbit)
Applications
WB, IHC-P-Leica, FC/FACS, IHC, EIA
Purity
Peptide Affinity Purified Rabbit Polyclonal Antibody (Pab)
Pricing


 Application Data
(Published clone specific image: Flow cytometric analysis of AM from NO2-exposed and control rats. Rats were exposed to NO2 for the indicated times and BAL cells were stained with antibodies to ED7, ED9, RM-4, and OX-6. To overcome autofluorescence signals, primary antibodies were detected using a biotin-PE/streptavidin-anti-streptavidin enhancing system and labeling of AM was analyzed by flow cytometry following gating by help of forward and sideward scatter properties. Shown are representative results of at least six animals per group.From: Garn H, Siese A, Stumpf S, Wensing A, Renz H, Gemsa D. Phenotypical and functional characterization of alveolar macrophage subpopulations in the lungs of NO2-exposed rats. Respir Res. 2006 Jan 6;7:4.)
Application Data
(Published clone specific image: Flow cytometric analysis of AM from NO2-exposed and control rats. Rats were exposed to NO2 for the indicated times and BAL cells were stained with antibodies to ED7, ED9, RM-4, and OX-6. To overcome autofluorescence signals, primary antibodies were detected using a biotin-PE/streptavidin-anti-streptavidin enhancing system and labeling of AM was analyzed by flow cytometry following gating by help of forward and sideward scatter properties. Shown are representative results of at least six animals per group.From: Garn H, Siese A, Stumpf S, Wensing A, Renz H, Gemsa D. Phenotypical and functional characterization of alveolar macrophage subpopulations in the lungs of NO2-exposed rats. Respir Res. 2006 Jan 6;7:4.)
CD172a, Monoclonal Antibody (Cat# AAA12001)
Full Name
MOUSE ANTI RAT CD172a
Gene Names
Sirpa; Bit; Ptpns1; SHPS-1
Applications
FC/FACS, IP, WB
Pricing


 FCM (Flow Cytometry)
(SOCS1 Antibody (N-term) flow cytometric analysis of WiDr cells (right histogram) compared to a negative control cell (left histogram).FITC-conjugated goat-anti-rabbit secondary antibodies were used for the analysis.)
FCM (Flow Cytometry)
(SOCS1 Antibody (N-term) flow cytometric analysis of WiDr cells (right histogram) compared to a negative control cell (left histogram).FITC-conjugated goat-anti-rabbit secondary antibodies were used for the analysis.)
SOCS1, Polyclonal Antibody (Cat# AAA28752)
Full Name
SOCS1 Antibody (N-term)
Gene Names
SOCS1; JAB; CIS1; SSI1; TIP3; CISH1; SSI-1; SOCS-1
Reactivity
Mouse, rat
Applications
WB, EIA, IHC, IF, FC
Purity
Purified Rabbit Polyclonal Antibody (Pab)
Pricing


 Application Data
(Immunoperoxidase staining of rat lymph node cryosection with Mouse anti Rat CD25 followed by horseradish peroxidase conjugated Goat anti Mouse IgG1 as a detection reagent. High power)
Application Data
(Immunoperoxidase staining of rat lymph node cryosection with Mouse anti Rat CD25 followed by horseradish peroxidase conjugated Goat anti Mouse IgG1 as a detection reagent. High power)
CD25, Monoclonal Antibody (Cat# AAA11965)
Full Name
MOUSE ANTI RAT CD25
Gene Names
Il2ra; IL2RAC
Applications
EIA, FC/FACS, IP
Pricing


 Strength of Signal
(Analysis of Protein Array containing more than 19,000 full-length human proteins using Vimentin (VIM) Mouse Monoclonal Antibody (VM452)Z- and S- Score: The Z-score represents the strength of a signal that a monoclonal antibody (MAb) (in combination with a fluorescently-tagged anti-IgG secondary antibody) produces when binding to a particular protein on the HuProtTM array. Z-scores are described in units of standard deviations (SD's) above the mean value of all signals generated on that array. If targets on HuProtTM are arranged in descending order of the Z-score, the S-score is the difference (also in units of SD's) between the Z-score. S-score therefore represents the relative target specificity of a MAb to its intended target. A MAb is considered to specific to its intended target, if the MAb has an S-score of at least 2.5. For example, if a MAb binds to protein X with a Z-score of 43 and to protein Y with a Z-score of 14, then the S-score for the binding of that MAb to protein X is equal to 29.)
Strength of Signal
(Analysis of Protein Array containing more than 19,000 full-length human proteins using Vimentin (VIM) Mouse Monoclonal Antibody (VM452)Z- and S- Score: The Z-score represents the strength of a signal that a monoclonal antibody (MAb) (in combination with a fluorescently-tagged anti-IgG secondary antibody) produces when binding to a particular protein on the HuProtTM array. Z-scores are described in units of standard deviations (SD's) above the mean value of all signals generated on that array. If targets on HuProtTM are arranged in descending order of the Z-score, the S-score is the difference (also in units of SD's) between the Z-score. S-score therefore represents the relative target specificity of a MAb to its intended target. A MAb is considered to specific to its intended target, if the MAb has an S-score of at least 2.5. For example, if a MAb binds to protein X with a Z-score of 43 and to protein Y with a Z-score of 14, then the S-score for the binding of that MAb to protein X is equal to 29.)
Vimentin, Monoclonal Antibody (Cat# AAA13810)
Full Name
Vimentin (Mesenchymal Cell Marker) Mouse Monoclonal Antibody
Gene Names
VIM; HEL113; CTRCT30
Reactivity
Human, Cow, Dog, Cat, Pig, Goat, Chicken.
Does not react with Mouse and Rat
Does not react with Mouse and Rat
Applications
FC/FACS, IF, WB, IHC
Pricing


 IF (Immunofluorescence)
(Fluorescent confocal image of MCF-7 cell stained with BHLH3 Antibody (N-term). MCF-7 cells were fixed with 4% PFA (20 min), permeabilized with Triton X-100 (0.1%, 10 min), then incubated with BHLH3 primary antibody (1:25, 1 h at 37 degree). For secondary antibody, Alexa Fluor 488 conjugated donkey anti-rabbit antibody (green) was used (1:400, 50 min at 37 degree).Cytoplasmic actin was counterstained with Alexa Fluor 555 (red) conjugated Phalloidin (7units/ml, 1 h at 37 degree). Nuclei were counterstained with DAPI (blue) (10 ug/ml, 10 min).BHLH3 immunoreactivity is localized to nucleus significantly.)
IF (Immunofluorescence)
(Fluorescent confocal image of MCF-7 cell stained with BHLH3 Antibody (N-term). MCF-7 cells were fixed with 4% PFA (20 min), permeabilized with Triton X-100 (0.1%, 10 min), then incubated with BHLH3 primary antibody (1:25, 1 h at 37 degree). For secondary antibody, Alexa Fluor 488 conjugated donkey anti-rabbit antibody (green) was used (1:400, 50 min at 37 degree).Cytoplasmic actin was counterstained with Alexa Fluor 555 (red) conjugated Phalloidin (7units/ml, 1 h at 37 degree). Nuclei were counterstained with DAPI (blue) (10 ug/ml, 10 min).BHLH3 immunoreactivity is localized to nucleus significantly.)
BHLH3, Polyclonal Antibody (Cat# AAA28734)
Full Name
BHLH3 Antibody (N-term)
Gene Names
BHLHE41; DEC2; hDEC2; BHLHB3; SHARP1
Reactivity
Human, Mouse
Applications
FC, IF, WB, EIA
Purity
This antibody is purified through a protein A column, followed by peptide affinity purification.
Pricing


 Application Data
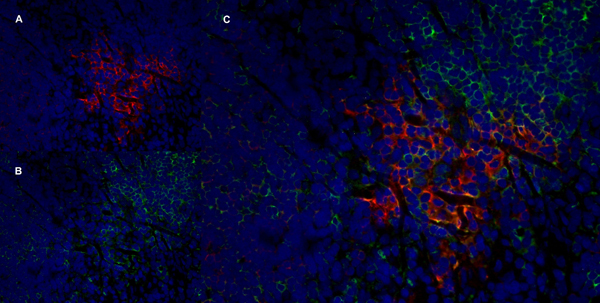
(Published customer image: Increased accumulation of repair-associated macrophages surrounding collaterals in ischemic hind limbs is PAR2-dependent. (A) Stainings of CD206-positive macrophages (green) and SMA-positive vessels (red) in non-ischemic (control) and ischemic (ligated) hind limbs of WT, PAR1-/- and PAR2-/- mice are shown. Nuclei were visualized with DAPI (blue). Arrows indicate single macrophages in the non-ischemic adductor. Quantification of the average number of repair-associated macrophages per vessel is indicated on the right. (B) Correlation between the number of CD206-positive macrophages in the ischemic tissues and the expression of CD11b and (C) CD115 on monocytes. ** p)
Application Data
(Published customer image: Increased accumulation of repair-associated macrophages surrounding collaterals in ischemic hind limbs is PAR2-dependent. (A) Stainings of CD206-positive macrophages (green) and SMA-positive vessels (red) in non-ischemic (control) and ischemic (ligated) hind limbs of WT, PAR1-/- and PAR2-/- mice are shown. Nuclei were visualized with DAPI (blue). Arrows indicate single macrophages in the non-ischemic adductor. Quantification of the average number of repair-associated macrophages per vessel is indicated on the right. (B) Correlation between the number of CD206-positive macrophages in the ischemic tissues and the expression of CD11b and (C) CD115 on monocytes. ** p)
CD206, Monoclonal Antibody (Cat# AAA12120)
Full Name
RAT ANTI MOUSE CD206:FITC
Gene Names
Mrc1; MR; CD206; AW259686
Applications
FC/FACS
Pricing


 Application Data
(Published customer image: Increased accumulation of repair-associated macrophages surrounding collaterals in ischemic hind limbs is PAR2-dependent. (A) Stainings of CD206-positive macrophages (green) and SMA-positive vessels (red) in non-ischemic (control) and ischemic (ligated) hind limbs of WT, PAR1-/- and PAR2-/- mice are shown. Nuclei were visualized with DAPI (blue). Arrows indicate single macrophages in the non-ischemic adductor. Quantification of the average number of repair-associated macrophages per vessel is indicated on the right. (B) Correlation between the number of CD206-positive macrophages in the ischemic tissues and the expression of CD11b and (C) CD115 on monocytes. ** p)
Application Data
(Published customer image: Increased accumulation of repair-associated macrophages surrounding collaterals in ischemic hind limbs is PAR2-dependent. (A) Stainings of CD206-positive macrophages (green) and SMA-positive vessels (red) in non-ischemic (control) and ischemic (ligated) hind limbs of WT, PAR1-/- and PAR2-/- mice are shown. Nuclei were visualized with DAPI (blue). Arrows indicate single macrophages in the non-ischemic adductor. Quantification of the average number of repair-associated macrophages per vessel is indicated on the right. (B) Correlation between the number of CD206-positive macrophages in the ischemic tissues and the expression of CD11b and (C) CD115 on monocytes. ** p)
CD206, Monoclonal Antibody (Cat# AAA12117)
Full Name
RAT ANTI MOUSE CD206:Biotin
Gene Names
Mrc1; MR; CD206; AW259686
Applications
FC/FACS
Pricing


 Application Data
(Published customer image: Increased accumulation of repair-associated macrophages surrounding collaterals in ischemic hind limbs is PAR2-dependent. (A) Stainings of CD206-positive macrophages (green) and SMA-positive vessels (red) in non-ischemic (control) and ischemic (ligated) hind limbs of WT, PAR1-/- and PAR2-/- mice are shown. Nuclei were visualized with DAPI (blue). Arrows indicate single macrophages in the non-ischemic adductor. Quantification of the average number of repair-associated macrophages per vessel is indicated on the right. (B) Correlation between the number of CD206-positive macrophages in the ischemic tissues and the expression of CD11b and (C) CD115 on monocytes. ** p)
Application Data
(Published customer image: Increased accumulation of repair-associated macrophages surrounding collaterals in ischemic hind limbs is PAR2-dependent. (A) Stainings of CD206-positive macrophages (green) and SMA-positive vessels (red) in non-ischemic (control) and ischemic (ligated) hind limbs of WT, PAR1-/- and PAR2-/- mice are shown. Nuclei were visualized with DAPI (blue). Arrows indicate single macrophages in the non-ischemic adductor. Quantification of the average number of repair-associated macrophages per vessel is indicated on the right. (B) Correlation between the number of CD206-positive macrophages in the ischemic tissues and the expression of CD11b and (C) CD115 on monocytes. ** p)
CD206, Monoclonal Antibody (Cat# AAA12121)
Full Name
RAT ANTI MOUSE CD206:FITC
Gene Names
Mrc1; MR; CD206; AW259686
Applications
FC/FACS
Pricing


 Application Data
(Published customer image: Increased accumulation of repair-associated macrophages surrounding collaterals in ischemic hind limbs is PAR2-dependent. (A) Stainings of CD206-positive macrophages (green) and SMA-positive vessels (red) in non-ischemic (control) and ischemic (ligated) hind limbs of WT, PAR1-/- and PAR2-/- mice are shown. Nuclei were visualized with DAPI (blue). Arrows indicate single macrophages in the non-ischemic adductor. Quantification of the average number of repair-associated macrophages per vessel is indicated on the right. (B) Correlation between the number of CD206-positive macrophages in the ischemic tissues and the expression of CD11b and (C) CD115 on monocytes. ** p)
Application Data
(Published customer image: Increased accumulation of repair-associated macrophages surrounding collaterals in ischemic hind limbs is PAR2-dependent. (A) Stainings of CD206-positive macrophages (green) and SMA-positive vessels (red) in non-ischemic (control) and ischemic (ligated) hind limbs of WT, PAR1-/- and PAR2-/- mice are shown. Nuclei were visualized with DAPI (blue). Arrows indicate single macrophages in the non-ischemic adductor. Quantification of the average number of repair-associated macrophages per vessel is indicated on the right. (B) Correlation between the number of CD206-positive macrophages in the ischemic tissues and the expression of CD11b and (C) CD115 on monocytes. ** p)
CD206, Monoclonal Antibody (Cat# AAA12119)
Full Name
RAT ANTI MOUSE CD206:FITC
Gene Names
Mrc1; MR; CD206; AW259686
Applications
FC/FACS
Pricing


 Application Data
(Published customer image: Increased accumulation of repair-associated macrophages surrounding collaterals in ischemic hind limbs is PAR2-dependent. (A) Stainings of CD206-positive macrophages (green) and SMA-positive vessels (red) in non-ischemic (control) and ischemic (ligated) hind limbs of WT, PAR1-/- and PAR2-/- mice are shown. Nuclei were visualized with DAPI (blue). Arrows indicate single macrophages in the non-ischemic adductor. Quantification of the average number of repair-associated macrophages per vessel is indicated on the right. (B) Correlation between the number of CD206-positive macrophages in the ischemic tissues and the expression of CD11b and (C) CD115 on monocytes. ** p)
Application Data
(Published customer image: Increased accumulation of repair-associated macrophages surrounding collaterals in ischemic hind limbs is PAR2-dependent. (A) Stainings of CD206-positive macrophages (green) and SMA-positive vessels (red) in non-ischemic (control) and ischemic (ligated) hind limbs of WT, PAR1-/- and PAR2-/- mice are shown. Nuclei were visualized with DAPI (blue). Arrows indicate single macrophages in the non-ischemic adductor. Quantification of the average number of repair-associated macrophages per vessel is indicated on the right. (B) Correlation between the number of CD206-positive macrophages in the ischemic tissues and the expression of CD11b and (C) CD115 on monocytes. ** p)
CD206, Monoclonal Antibody (Cat# AAA12124)
Full Name
RAT ANTI MOUSE CD206:RPE
Gene Names
Mrc1; MR; CD206; AW259686
Applications
FC/FACS
Pricing


 IF (Immunofluorescence)
(Confocal immunofluorescent analysis of GAPDH Antibody (C-term R248) with Hela cell followed by Alexa Fluor 488-conjugated goat anti-rabbit lgG (green). Actin filaments have been labeled with Alexa Fluor 555 phalloidin (red).DAPI was used to stain the cell nuclear (blue).)
IF (Immunofluorescence)
(Confocal immunofluorescent analysis of GAPDH Antibody (C-term R248) with Hela cell followed by Alexa Fluor 488-conjugated goat anti-rabbit lgG (green). Actin filaments have been labeled with Alexa Fluor 555 phalloidin (red).DAPI was used to stain the cell nuclear (blue).)
GAPDH, Polyclonal Antibody (Cat# AAA28693)
Full Name
GAPDH Antibody (C-term R248)
Gene Names
GAPDH; G3PD; GAPD; HEL-S-162eP
Reactivity
Human (Predicted Reactivity: Chicken, Mouse, Pig, Rat)
Applications
WB, EIA, IHC, FC/FACS, IF
Purity
Purified Rabbit Polyclonal Antibody (Pab)
Pricing


 Application Data
(Published customer image: Increased accumulation of repair-associated macrophages surrounding collaterals in ischemic hind limbs is PAR2-dependent. (A) Stainings of CD206-positive macrophages (green) and SMA-positive vessels (red) in non-ischemic (control) and ischemic (ligated) hind limbs of WT, PAR1-/- and PAR2-/- mice are shown. Nuclei were visualized with DAPI (blue). Arrows indicate single macrophages in the non-ischemic adductor. Quantification of the average number of repair-associated macrophages per vessel is indicated on the right. (B) Correlation between the number of CD206-positive macrophages in the ischemic tissues and the expression of CD11b and (C) CD115 on monocytes. ** p)
Application Data
(Published customer image: Increased accumulation of repair-associated macrophages surrounding collaterals in ischemic hind limbs is PAR2-dependent. (A) Stainings of CD206-positive macrophages (green) and SMA-positive vessels (red) in non-ischemic (control) and ischemic (ligated) hind limbs of WT, PAR1-/- and PAR2-/- mice are shown. Nuclei were visualized with DAPI (blue). Arrows indicate single macrophages in the non-ischemic adductor. Quantification of the average number of repair-associated macrophages per vessel is indicated on the right. (B) Correlation between the number of CD206-positive macrophages in the ischemic tissues and the expression of CD11b and (C) CD115 on monocytes. ** p)
CD206, Monoclonal Antibody (Cat# AAA12122)
Full Name
RAT ANTI MOUSE CD206:FITC
Gene Names
Mrc1; MR; CD206; AW259686
Applications
FC/FACS
Pricing


 Application Data
(Published customer image: Increased accumulation of repair-associated macrophages surrounding collaterals in ischemic hind limbs is PAR2-dependent. (A) Stainings of CD206-positive macrophages (green) and SMA-positive vessels (red) in non-ischemic (control) and ischemic (ligated) hind limbs of WT, PAR1-/- and PAR2-/- mice are shown. Nuclei were visualized with DAPI (blue). Arrows indicate single macrophages in the non-ischemic adductor. Quantification of the average number of repair-associated macrophages per vessel is indicated on the right. (B) Correlation between the number of CD206-positive macrophages in the ischemic tissues and the expression of CD11b and (C) CD115 on monocytes. ** p)
Application Data
(Published customer image: Increased accumulation of repair-associated macrophages surrounding collaterals in ischemic hind limbs is PAR2-dependent. (A) Stainings of CD206-positive macrophages (green) and SMA-positive vessels (red) in non-ischemic (control) and ischemic (ligated) hind limbs of WT, PAR1-/- and PAR2-/- mice are shown. Nuclei were visualized with DAPI (blue). Arrows indicate single macrophages in the non-ischemic adductor. Quantification of the average number of repair-associated macrophages per vessel is indicated on the right. (B) Correlation between the number of CD206-positive macrophages in the ischemic tissues and the expression of CD11b and (C) CD115 on monocytes. ** p)
CD206, Monoclonal Antibody (Cat# AAA12125)
Full Name
RAT ANTI MOUSE CD206:RPE
Gene Names
Mrc1; MR; CD206; AW259686
Applications
FC/FACS
Pricing


 Application Data
(Published customer image: Increased accumulation of repair-associated macrophages surrounding collaterals in ischemic hind limbs is PAR2-dependent. (A) Stainings of CD206-positive macrophages (green) and SMA-positive vessels (red) in non-ischemic (control) and ischemic (ligated) hind limbs of WT, PAR1-/- and PAR2-/- mice are shown. Nuclei were visualized with DAPI (blue). Arrows indicate single macrophages in the non-ischemic adductor. Quantification of the average number of repair-associated macrophages per vessel is indicated on the right. (B) Correlation between the number of CD206-positive macrophages in the ischemic tissues and the expression of CD11b and (C) CD115 on monocytes. ** p)
Application Data
(Published customer image: Increased accumulation of repair-associated macrophages surrounding collaterals in ischemic hind limbs is PAR2-dependent. (A) Stainings of CD206-positive macrophages (green) and SMA-positive vessels (red) in non-ischemic (control) and ischemic (ligated) hind limbs of WT, PAR1-/- and PAR2-/- mice are shown. Nuclei were visualized with DAPI (blue). Arrows indicate single macrophages in the non-ischemic adductor. Quantification of the average number of repair-associated macrophages per vessel is indicated on the right. (B) Correlation between the number of CD206-positive macrophages in the ischemic tissues and the expression of CD11b and (C) CD115 on monocytes. ** p)
CD206, Monoclonal Antibody (Cat# AAA12118)
Full Name
RAT ANTI MOUSE CD206:Biotin
Gene Names
Mrc1; MR; CD206; AW259686
Applications
FC/FACS
Pricing


 Application Data
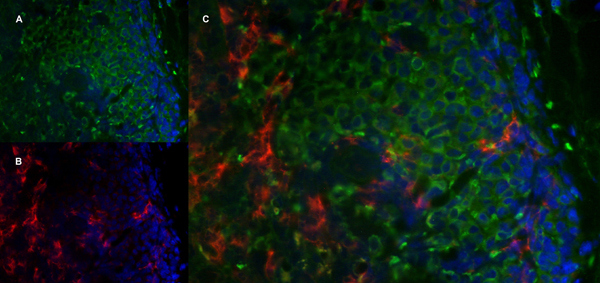
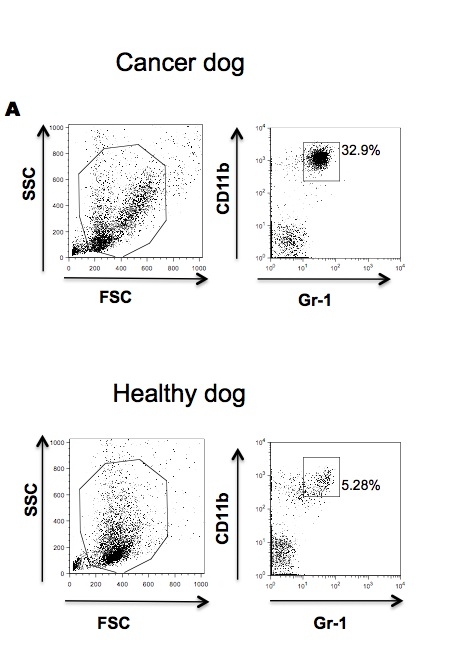
(Published customer image: Effects of EDTA versus media storage of patient blood samples on flow cytometric results. Peripheral blood cells were (a) stained immediate following collection with CD11b and CADO48A or maintained in EDTA collection tubes for (b) 24 or (c) 48 hours or in media for (d) 24 or (e) 48 hours prior to staining with CD11b and CADO48A. Both EDTA and media samples were kept refrigerated. These findings show a decrease over time of population distinction in EDTA with minimal changes when cells are kept in media up to 48 hours. All cells were gated on P1.From: Sherger et al. BMC Veterinary Research 2012 8:209)
Application Data
(Published customer image: Effects of EDTA versus media storage of patient blood samples on flow cytometric results. Peripheral blood cells were (a) stained immediate following collection with CD11b and CADO48A or maintained in EDTA collection tubes for (b) 24 or (c) 48 hours or in media for (d) 24 or (e) 48 hours prior to staining with CD11b and CADO48A. Both EDTA and media samples were kept refrigerated. These findings show a decrease over time of population distinction in EDTA with minimal changes when cells are kept in media up to 48 hours. All cells were gated on P1.From: Sherger et al. BMC Veterinary Research 2012 8:209)
CD11b, Monoclonal Antibody (Cat# AAA12092)
Full Name
MOUSE ANTI DOG CD11b
Gene Names
ITGAM; CD11B
Applications
FC/FACS, IP
Pricing


 Application Data
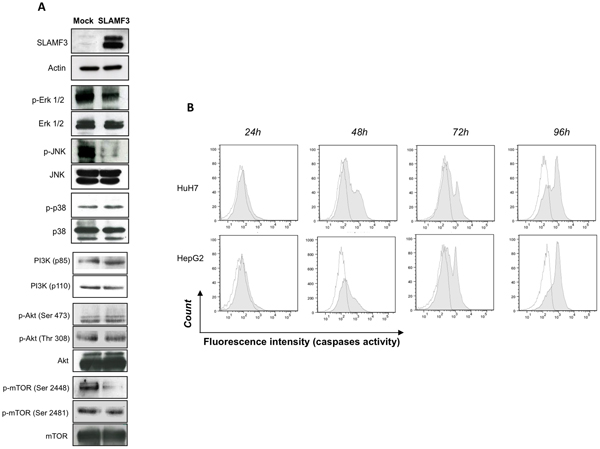
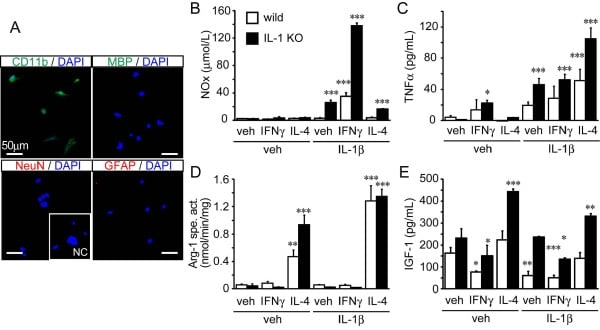
(Published customer imageSLAMF3 blockade in human hepatocytes is associated with lower susceptibility to HCV. (A) SLAMF3 was stained in primary human hepatocytes (PHHs) and cells from the Huh-7 human hepatoma cell line with a specific antibody (HLy9.1.25 clone; grey) and an isotype-matched control (empty). One of four independent experiments is shown. Huh-7 cells were transfected with scrambled control (sc) siRNA or three specific siRNAs (#1, #2 and #3) targeting SLAMF3, prior to infection with HCVcc; siRNA efficiency was checked by quantifying SLAMF3 mRNA (B) and the CD81 expression level (C) by flow cytometry analysis at 48 h post-transfection. Results are presented as the mean +/-SD (n = 3). Intracellular viral RNA was quantified at 72 h p.i. (D) and the infection was measured at 72 h p.i. by focus-forming units FFUs counting (E) (as inhibition percent; mean of three independent experiments; error bars: SD. **p)
Application Data
(Published customer imageSLAMF3 blockade in human hepatocytes is associated with lower susceptibility to HCV. (A) SLAMF3 was stained in primary human hepatocytes (PHHs) and cells from the Huh-7 human hepatoma cell line with a specific antibody (HLy9.1.25 clone; grey) and an isotype-matched control (empty). One of four independent experiments is shown. Huh-7 cells were transfected with scrambled control (sc) siRNA or three specific siRNAs (#1, #2 and #3) targeting SLAMF3, prior to infection with HCVcc; siRNA efficiency was checked by quantifying SLAMF3 mRNA (B) and the CD81 expression level (C) by flow cytometry analysis at 48 h post-transfection. Results are presented as the mean +/-SD (n = 3). Intracellular viral RNA was quantified at 72 h p.i. (D) and the infection was measured at 72 h p.i. by focus-forming units FFUs counting (E) (as inhibition percent; mean of three independent experiments; error bars: SD. **p)
CD229, Monoclonal Antibody (Cat# AAA11951)
Full Name
MOUSE ANTI HUMAN CD229
Gene Names
LY9; hly9; mLY9; CD229; SLAMF3
Applications
FC/FACS, IP
Pricing


 Application Data
(Published customer image: Mouse anti Human CD49d antibody, clone HP2/1 used for binding efficiency determinationImage caption:Binding efficiencies (BE) of different a4beta7 molecules composed of distinct a4 mutants to monoclonal antibodies against a4, beta7 or the a4beta7 heterodimer. Binding efficiency is determined by the ratio between the mean fluorescence of antibody binding to each a4 molecule and of the binding in a mock-transfected cell culture (see Materials and Methods for details). Dark gray bars represent binding to the human (wild type) a4 clone, whereas light gray bars are those of binding to the different a4 mutants (as shown in the x-axis). a4 mutants which included substitutions at codon 201 are boxed. A, binding of anti-a4 2b4 antibody. B, binding of anti-a4 HP2/1 antibody. C, BE of different anti-a4 and beta7 antibodies to the human a4 and the quintuple a4 mutant (5 aa mut). Bars represent the range of standard errors deduced from triplicate experiments. p-values of Student's t tests are shown above each comparison. NS, non-significant (> 0.05).From:Darc M, Hait SH, Soares EA, Cicala C, Seuanez HN, et al. (2011) Polymorphisms in the a4 Integrin of Neotropical Primates: Insights for Binding of Natural Ligands and HIV-1 gp120 to the Human a4beta7. PLoS ONE 6(9): e24461.)
Application Data
(Published customer image: Mouse anti Human CD49d antibody, clone HP2/1 used for binding efficiency determinationImage caption:Binding efficiencies (BE) of different a4beta7 molecules composed of distinct a4 mutants to monoclonal antibodies against a4, beta7 or the a4beta7 heterodimer. Binding efficiency is determined by the ratio between the mean fluorescence of antibody binding to each a4 molecule and of the binding in a mock-transfected cell culture (see Materials and Methods for details). Dark gray bars represent binding to the human (wild type) a4 clone, whereas light gray bars are those of binding to the different a4 mutants (as shown in the x-axis). a4 mutants which included substitutions at codon 201 are boxed. A, binding of anti-a4 2b4 antibody. B, binding of anti-a4 HP2/1 antibody. C, BE of different anti-a4 and beta7 antibodies to the human a4 and the quintuple a4 mutant (5 aa mut). Bars represent the range of standard errors deduced from triplicate experiments. p-values of Student's t tests are shown above each comparison. NS, non-significant (> 0.05).From:Darc M, Hait SH, Soares EA, Cicala C, Seuanez HN, et al. (2011) Polymorphisms in the a4 Integrin of Neotropical Primates: Insights for Binding of Natural Ligands and HIV-1 gp120 to the Human a4beta7. PLoS ONE 6(9): e24461.)
CD49d, Monoclonal Antibody (Cat# AAA12002)
Full Name
MOUSE ANTI HUMAN CD49d
Gene Names
ITGA4; IA4; CD49D
Reactivity
Bovine, Cat, Cynomolgus monkey, Goat, Horse, Llama, Mink, Mustelid, Pig, Rabbit, Rat, Rhesus Monkey
Applications
FC/FACS, FN, IP
Pricing


 Application Data
(Published customer image: Mouse anti Human CD49d antibody, clone HP2/1 used for binding efficiency determinationImage caption:Binding efficiencies (BE) of different a4beta7 molecules composed of distinct a4 mutants to monoclonal antibodies against a4, beta7 or the a4beta7 heterodimer. Binding efficiency is determined by the ratio between the mean fluorescence of antibody binding to each a4 molecule and of the binding in a mock-transfected cell culture (see Materials and Methods for details). Dark gray bars represent binding to the human (wild type) a4 clone, whereas light gray bars are those of binding to the different a4 mutants (as shown in the x-axis). a4 mutants which included substitutions at codon 201 are boxed. A, binding of anti-a4 2b4 antibody. B, binding of anti-a4 HP2/1 antibody. C, BE of different anti-a4 and beta7 antibodies to the human a4 and the quintuple a4 mutant (5 aa mut). Bars represent the range of standard errors deduced from triplicate experiments. p-values of Student's t tests are shown above each comparison. NS, non-significant (> 0.05).From:Darc M, Hait SH, Soares EA, Cicala C, Seuanez HN, et al. (2011) Polymorphisms in the a4 Integrin of Neotropical Primates: Insights for Binding of Natural Ligands and HIV-1 gp120 to the Human a4beta7. PLoS ONE 6(9): e24461.)
Application Data
(Published customer image: Mouse anti Human CD49d antibody, clone HP2/1 used for binding efficiency determinationImage caption:Binding efficiencies (BE) of different a4beta7 molecules composed of distinct a4 mutants to monoclonal antibodies against a4, beta7 or the a4beta7 heterodimer. Binding efficiency is determined by the ratio between the mean fluorescence of antibody binding to each a4 molecule and of the binding in a mock-transfected cell culture (see Materials and Methods for details). Dark gray bars represent binding to the human (wild type) a4 clone, whereas light gray bars are those of binding to the different a4 mutants (as shown in the x-axis). a4 mutants which included substitutions at codon 201 are boxed. A, binding of anti-a4 2b4 antibody. B, binding of anti-a4 HP2/1 antibody. C, BE of different anti-a4 and beta7 antibodies to the human a4 and the quintuple a4 mutant (5 aa mut). Bars represent the range of standard errors deduced from triplicate experiments. p-values of Student's t tests are shown above each comparison. NS, non-significant (> 0.05).From:Darc M, Hait SH, Soares EA, Cicala C, Seuanez HN, et al. (2011) Polymorphisms in the a4 Integrin of Neotropical Primates: Insights for Binding of Natural Ligands and HIV-1 gp120 to the Human a4beta7. PLoS ONE 6(9): e24461.)
CD49d, Monoclonal Antibody (Cat# AAA12003)
Full Name
MOUSE ANTI HUMAN CD49d
Gene Names
ITGA4; IA4; CD49D
Applications
FC/FACS, FN, IP
Pricing


 Application Data
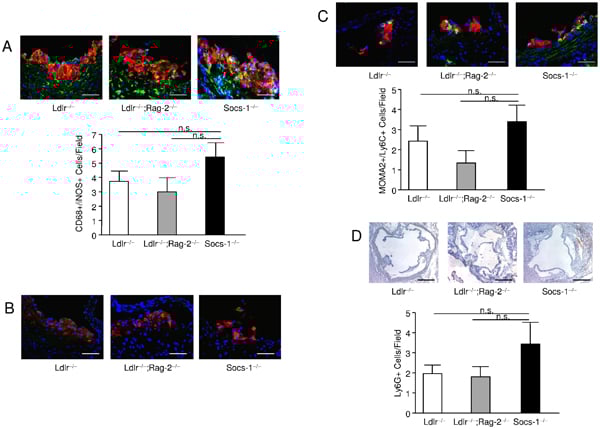
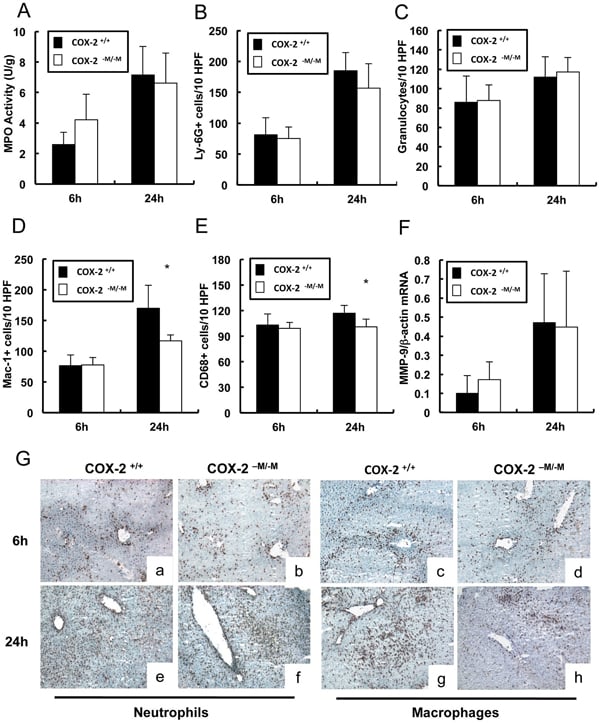
(Published customer image: Leukocyte infiltration in COX-2-M/-M and COX-2+/+ mice. MPO enzymatic activity (panel A) was statistically similar in COX-2-M/-M and COX-2+/+ livers at 6 h and 24 h post-IRI. Ly-6G+ neutrophil (panel B) and granulocyte (panel C) infiltration were also comparable in COX-2-M/-M and COX-2+/+ livers after IRI. Mac-1+ (panel D) and CD68 (panel E) infiltrating macrophages were significantly reduced in COX-2-M/-M livers at 24 h post-reperfusion, but were statistically indistinguishable in COX-2-M/-M and COX-2+/+ livers at 6 h after IRI. No statistical differences in MMP-9 expression (panel F) could be demonstrated in livers of COX-2-M/-M and COX-2+/+ mice post-IRI. Representative immunostaining (panel G) of infiltrating Ly-6G+ (a,b,e,f) and Mac-1+ (c,d,g,h) leukocytes in livers of COX-2+/+ (a,c,e,g) and COX-2-M/-M (b,d,f,h) mice at 6 h (a to d) and 24 h (e to h) post IRI; (n = 5 -6/group; * indicates p)
Application Data
(Published customer image: Leukocyte infiltration in COX-2-M/-M and COX-2+/+ mice. MPO enzymatic activity (panel A) was statistically similar in COX-2-M/-M and COX-2+/+ livers at 6 h and 24 h post-IRI. Ly-6G+ neutrophil (panel B) and granulocyte (panel C) infiltration were also comparable in COX-2-M/-M and COX-2+/+ livers after IRI. Mac-1+ (panel D) and CD68 (panel E) infiltrating macrophages were significantly reduced in COX-2-M/-M livers at 24 h post-reperfusion, but were statistically indistinguishable in COX-2-M/-M and COX-2+/+ livers at 6 h after IRI. No statistical differences in MMP-9 expression (panel F) could be demonstrated in livers of COX-2-M/-M and COX-2+/+ mice post-IRI. Representative immunostaining (panel G) of infiltrating Ly-6G+ (a,b,e,f) and Mac-1+ (c,d,g,h) leukocytes in livers of COX-2+/+ (a,c,e,g) and COX-2-M/-M (b,d,f,h) mice at 6 h (a to d) and 24 h (e to h) post IRI; (n = 5 -6/group; * indicates p)
CD68, Monoclonal Antibody (Cat# AAA12104)
Full Name
RAT ANTI MOUSE CD68:Biotin
Gene Names
Cd68; Lamp4; gp110; Scard1
Applications
FC/FACS
Pricing


 Application Data
(Published customer image: Leukocyte infiltration in COX-2-M/-M and COX-2+/+ mice. MPO enzymatic activity (panel A) was statistically similar in COX-2-M/-M and COX-2+/+ livers at 6 h and 24 h post-IRI. Ly-6G+ neutrophil (panel B) and granulocyte (panel C) infiltration were also comparable in COX-2-M/-M and COX-2+/+ livers after IRI. Mac-1+ (panel D) and CD68 (panel E) infiltrating macrophages were significantly reduced in COX-2-M/-M livers at 24 h post-reperfusion, but were statistically indistinguishable in COX-2-M/-M and COX-2+/+ livers at 6 h after IRI. No statistical differences in MMP-9 expression (panel F) could be demonstrated in livers of COX-2-M/-M and COX-2+/+ mice post-IRI. Representative immunostaining (panel G) of infiltrating Ly-6G+ (a,b,e,f) and Mac-1+ (c,d,g,h) leukocytes in livers of COX-2+/+ (a,c,e,g) and COX-2-M/-M (b,d,f,h) mice at 6 h (a to d) and 24 h (e to h) post IRI; (n = 5 -6/group; * indicates p)
Application Data
(Published customer image: Leukocyte infiltration in COX-2-M/-M and COX-2+/+ mice. MPO enzymatic activity (panel A) was statistically similar in COX-2-M/-M and COX-2+/+ livers at 6 h and 24 h post-IRI. Ly-6G+ neutrophil (panel B) and granulocyte (panel C) infiltration were also comparable in COX-2-M/-M and COX-2+/+ livers after IRI. Mac-1+ (panel D) and CD68 (panel E) infiltrating macrophages were significantly reduced in COX-2-M/-M livers at 24 h post-reperfusion, but were statistically indistinguishable in COX-2-M/-M and COX-2+/+ livers at 6 h after IRI. No statistical differences in MMP-9 expression (panel F) could be demonstrated in livers of COX-2-M/-M and COX-2+/+ mice post-IRI. Representative immunostaining (panel G) of infiltrating Ly-6G+ (a,b,e,f) and Mac-1+ (c,d,g,h) leukocytes in livers of COX-2+/+ (a,c,e,g) and COX-2-M/-M (b,d,f,h) mice at 6 h (a to d) and 24 h (e to h) post IRI; (n = 5 -6/group; * indicates p)
CD68, Monoclonal Antibody (Cat# AAA12108)
Full Name
RAT ANTI MOUSE CD68:RPE
Gene Names
Cd68; Lamp4; gp110; Scard1
Applications
FC/FACS
Pricing


 Application Data
(Published customer image: Leukocyte infiltration in COX-2-M/-M and COX-2+/+ mice. MPO enzymatic activity (panel A) was statistically similar in COX-2-M/-M and COX-2+/+ livers at 6 h and 24 h post-IRI. Ly-6G+ neutrophil (panel B) and granulocyte (panel C) infiltration were also comparable in COX-2-M/-M and COX-2+/+ livers after IRI. Mac-1+ (panel D) and CD68 (panel E) infiltrating macrophages were significantly reduced in COX-2-M/-M livers at 24 h post-reperfusion, but were statistically indistinguishable in COX-2-M/-M and COX-2+/+ livers at 6 h after IRI. No statistical differences in MMP-9 expression (panel F) could be demonstrated in livers of COX-2-M/-M and COX-2+/+ mice post-IRI. Representative immunostaining (panel G) of infiltrating Ly-6G+ (a,b,e,f) and Mac-1+ (c,d,g,h) leukocytes in livers of COX-2+/+ (a,c,e,g) and COX-2-M/-M (b,d,f,h) mice at 6 h (a to d) and 24 h (e to h) post IRI; (n = 5 -6/group; * indicates p)
Application Data
(Published customer image: Leukocyte infiltration in COX-2-M/-M and COX-2+/+ mice. MPO enzymatic activity (panel A) was statistically similar in COX-2-M/-M and COX-2+/+ livers at 6 h and 24 h post-IRI. Ly-6G+ neutrophil (panel B) and granulocyte (panel C) infiltration were also comparable in COX-2-M/-M and COX-2+/+ livers after IRI. Mac-1+ (panel D) and CD68 (panel E) infiltrating macrophages were significantly reduced in COX-2-M/-M livers at 24 h post-reperfusion, but were statistically indistinguishable in COX-2-M/-M and COX-2+/+ livers at 6 h after IRI. No statistical differences in MMP-9 expression (panel F) could be demonstrated in livers of COX-2-M/-M and COX-2+/+ mice post-IRI. Representative immunostaining (panel G) of infiltrating Ly-6G+ (a,b,e,f) and Mac-1+ (c,d,g,h) leukocytes in livers of COX-2+/+ (a,c,e,g) and COX-2-M/-M (b,d,f,h) mice at 6 h (a to d) and 24 h (e to h) post IRI; (n = 5 -6/group; * indicates p)
CD68, Monoclonal Antibody (Cat# AAA12105)
Full Name
RAT ANTI MOUSE CD68:FITC
Gene Names
Cd68; Lamp4; gp110; Scard1
Applications
FC/FACS
Pricing


 Application Data
(Published customer image: Leukocyte infiltration in COX-2-M/-M and COX-2+/+ mice. MPO enzymatic activity (panel A) was statistically similar in COX-2-M/-M and COX-2+/+ livers at 6 h and 24 h post-IRI. Ly-6G+ neutrophil (panel B) and granulocyte (panel C) infiltration were also comparable in COX-2-M/-M and COX-2+/+ livers after IRI. Mac-1+ (panel D) and CD68 (panel E) infiltrating macrophages were significantly reduced in COX-2-M/-M livers at 24 h post-reperfusion, but were statistically indistinguishable in COX-2-M/-M and COX-2+/+ livers at 6 h after IRI. No statistical differences in MMP-9 expression (panel F) could be demonstrated in livers of COX-2-M/-M and COX-2+/+ mice post-IRI. Representative immunostaining (panel G) of infiltrating Ly-6G+ (a,b,e,f) and Mac-1+ (c,d,g,h) leukocytes in livers of COX-2+/+ (a,c,e,g) and COX-2-M/-M (b,d,f,h) mice at 6 h (a to d) and 24 h (e to h) post IRI; (n = 5 -6/group; * indicates p)
Application Data
(Published customer image: Leukocyte infiltration in COX-2-M/-M and COX-2+/+ mice. MPO enzymatic activity (panel A) was statistically similar in COX-2-M/-M and COX-2+/+ livers at 6 h and 24 h post-IRI. Ly-6G+ neutrophil (panel B) and granulocyte (panel C) infiltration were also comparable in COX-2-M/-M and COX-2+/+ livers after IRI. Mac-1+ (panel D) and CD68 (panel E) infiltrating macrophages were significantly reduced in COX-2-M/-M livers at 24 h post-reperfusion, but were statistically indistinguishable in COX-2-M/-M and COX-2+/+ livers at 6 h after IRI. No statistical differences in MMP-9 expression (panel F) could be demonstrated in livers of COX-2-M/-M and COX-2+/+ mice post-IRI. Representative immunostaining (panel G) of infiltrating Ly-6G+ (a,b,e,f) and Mac-1+ (c,d,g,h) leukocytes in livers of COX-2+/+ (a,c,e,g) and COX-2-M/-M (b,d,f,h) mice at 6 h (a to d) and 24 h (e to h) post IRI; (n = 5 -6/group; * indicates p)
CD68, Monoclonal Antibody (Cat# AAA12109)
Full Name
RAT ANTI MOUSE CD68:RPE
Gene Names
Cd68; Lamp4; gp110; Scard1
Applications
FC/FACS
Pricing


 Application Data
(Published customer image: Leukocyte infiltration in COX-2-M/-M and COX-2+/+ mice. MPO enzymatic activity (panel A) was statistically similar in COX-2-M/-M and COX-2+/+ livers at 6 h and 24 h post-IRI. Ly-6G+ neutrophil (panel B) and granulocyte (panel C) infiltration were also comparable in COX-2-M/-M and COX-2+/+ livers after IRI. Mac-1+ (panel D) and CD68 (panel E) infiltrating macrophages were significantly reduced in COX-2-M/-M livers at 24 h post-reperfusion, but were statistically indistinguishable in COX-2-M/-M and COX-2+/+ livers at 6 h after IRI. No statistical differences in MMP-9 expression (panel F) could be demonstrated in livers of COX-2-M/-M and COX-2+/+ mice post-IRI. Representative immunostaining (panel G) of infiltrating Ly-6G+ (a,b,e,f) and Mac-1+ (c,d,g,h) leukocytes in livers of COX-2+/+ (a,c,e,g) and COX-2-M/-M (b,d,f,h) mice at 6 h (a to d) and 24 h (e to h) post IRI; (n = 5 -6/group; * indicates p)
Application Data
(Published customer image: Leukocyte infiltration in COX-2-M/-M and COX-2+/+ mice. MPO enzymatic activity (panel A) was statistically similar in COX-2-M/-M and COX-2+/+ livers at 6 h and 24 h post-IRI. Ly-6G+ neutrophil (panel B) and granulocyte (panel C) infiltration were also comparable in COX-2-M/-M and COX-2+/+ livers after IRI. Mac-1+ (panel D) and CD68 (panel E) infiltrating macrophages were significantly reduced in COX-2-M/-M livers at 24 h post-reperfusion, but were statistically indistinguishable in COX-2-M/-M and COX-2+/+ livers at 6 h after IRI. No statistical differences in MMP-9 expression (panel F) could be demonstrated in livers of COX-2-M/-M and COX-2+/+ mice post-IRI. Representative immunostaining (panel G) of infiltrating Ly-6G+ (a,b,e,f) and Mac-1+ (c,d,g,h) leukocytes in livers of COX-2+/+ (a,c,e,g) and COX-2-M/-M (b,d,f,h) mice at 6 h (a to d) and 24 h (e to h) post IRI; (n = 5 -6/group; * indicates p)
CD68, Monoclonal Antibody (Cat# AAA12106)
Full Name
RAT ANTI MOUSE CD68:FITC
Gene Names
Cd68; Lamp4; gp110; Scard1
Applications
FC/FACS
Pricing


 Application Data
(Published customer image: Leukocyte infiltration in COX-2-M/-M and COX-2+/+ mice. MPO enzymatic activity (panel A) was statistically similar in COX-2-M/-M and COX-2+/+ livers at 6 h and 24 h post-IRI. Ly-6G+ neutrophil (panel B) and granulocyte (panel C) infiltration were also comparable in COX-2-M/-M and COX-2+/+ livers after IRI. Mac-1+ (panel D) and CD68 (panel E) infiltrating macrophages were significantly reduced in COX-2-M/-M livers at 24 h post-reperfusion, but were statistically indistinguishable in COX-2-M/-M and COX-2+/+ livers at 6 h after IRI. No statistical differences in MMP-9 expression (panel F) could be demonstrated in livers of COX-2-M/-M and COX-2+/+ mice post-IRI. Representative immunostaining (panel G) of infiltrating Ly-6G+ (a,b,e,f) and Mac-1+ (c,d,g,h) leukocytes in livers of COX-2+/+ (a,c,e,g) and COX-2-M/-M (b,d,f,h) mice at 6 h (a to d) and 24 h (e to h) post IRI; (n = 5 -6/group; * indicates p)
Application Data
(Published customer image: Leukocyte infiltration in COX-2-M/-M and COX-2+/+ mice. MPO enzymatic activity (panel A) was statistically similar in COX-2-M/-M and COX-2+/+ livers at 6 h and 24 h post-IRI. Ly-6G+ neutrophil (panel B) and granulocyte (panel C) infiltration were also comparable in COX-2-M/-M and COX-2+/+ livers after IRI. Mac-1+ (panel D) and CD68 (panel E) infiltrating macrophages were significantly reduced in COX-2-M/-M livers at 24 h post-reperfusion, but were statistically indistinguishable in COX-2-M/-M and COX-2+/+ livers at 6 h after IRI. No statistical differences in MMP-9 expression (panel F) could be demonstrated in livers of COX-2-M/-M and COX-2+/+ mice post-IRI. Representative immunostaining (panel G) of infiltrating Ly-6G+ (a,b,e,f) and Mac-1+ (c,d,g,h) leukocytes in livers of COX-2+/+ (a,c,e,g) and COX-2-M/-M (b,d,f,h) mice at 6 h (a to d) and 24 h (e to h) post IRI; (n = 5 -6/group; * indicates p)
CD68, Monoclonal Antibody (Cat# AAA12103)
Full Name
RAT ANTI MOUSE CD68:Biotin
Gene Names
Cd68; Lamp4; gp110; Scard1
Applications
FC/FACS
Pricing


 Application Data
(Published customer image Infiltration of GFP+ BM-cells in infarct and peri-infarct regions. (A-B) Dot plots of viable macrophages/granulocytes (CD11b+CD45high, top right quadrants) and microglia (CD11b+CD45dim, bottom right quadrants) in cortex from BM-chimeric unmanipulated mice and mice exposed to pMCAO. (C) Bar graph showing mean numbers of CD11b+CD45dim microglia and CD11b+CD45high macrophages/granulocytes in BM-chimeric mice 24 hours after pMCAO, subdivided based on expression of GFP (n = 5). Approximately 92% of of the CD45high population were GFP+. (D) Estimation and comparison of mean numbers of CD11b+CD45dim microglia in non-chimeric (n = 10) versus BM-chimeric mice (n = 5) 24 hours after of pMCAO shows significantly fewer CD11b+CD45dim microglial cells in irradiated mice. (E) Overview, showing distribution of infiltrating GFP+ BM-derived cells into infarct (IF) and peri-infarct (P-IF) regions 24 hours after pMCAO. (E-G) By 24 hours, GFP+ single cells (F) and vessel-associated aggregates of GFP+ cells (arrows in G) were observed in infarct and peri-infarct regions. Some of the vessel-associated cells were round, leukocyte-like cells (arrows) while others were elongated cells lining the vasculature (arrow heads in G and in insert). (H) Bar graph showing mean numbers of single GFP+ cells and vessel-associated aggregates of GFP+ cells in ipsi- and contralateral cortex 24 hours after surgery (n = 10). (I-P) Immunohistochemical staining of CD45.1 (I, K), CD45.2 (J, L), IgG2a (M, O) and CD45 (N, P) in ischemic tissue in BM-chimeric (I, J, M, N) and non-chimeric mice (K, L, O, P) 24 hours after pMCAO. N.D, none detected. Scale bars: 200 um (A), 10 um (B, C). 50 um (I-P) *P < 0.05, **P < 0.01, and ***P < 0.001.From: Clausen BH, Lambertsen KL, Babcock AA, Holm TH, Dagnaes-Hansen F, Finsen B. Interleukin-1beta and tumor necrosis factor-alpha are expressed by different subsets of microglia and macrophages after ischemic stroke in mice. J Neuroinflammation. 2008 Oct 23;5:46.)
Application Data
(Published customer image Infiltration of GFP+ BM-cells in infarct and peri-infarct regions. (A-B) Dot plots of viable macrophages/granulocytes (CD11b+CD45high, top right quadrants) and microglia (CD11b+CD45dim, bottom right quadrants) in cortex from BM-chimeric unmanipulated mice and mice exposed to pMCAO. (C) Bar graph showing mean numbers of CD11b+CD45dim microglia and CD11b+CD45high macrophages/granulocytes in BM-chimeric mice 24 hours after pMCAO, subdivided based on expression of GFP (n = 5). Approximately 92% of of the CD45high population were GFP+. (D) Estimation and comparison of mean numbers of CD11b+CD45dim microglia in non-chimeric (n = 10) versus BM-chimeric mice (n = 5) 24 hours after of pMCAO shows significantly fewer CD11b+CD45dim microglial cells in irradiated mice. (E) Overview, showing distribution of infiltrating GFP+ BM-derived cells into infarct (IF) and peri-infarct (P-IF) regions 24 hours after pMCAO. (E-G) By 24 hours, GFP+ single cells (F) and vessel-associated aggregates of GFP+ cells (arrows in G) were observed in infarct and peri-infarct regions. Some of the vessel-associated cells were round, leukocyte-like cells (arrows) while others were elongated cells lining the vasculature (arrow heads in G and in insert). (H) Bar graph showing mean numbers of single GFP+ cells and vessel-associated aggregates of GFP+ cells in ipsi- and contralateral cortex 24 hours after surgery (n = 10). (I-P) Immunohistochemical staining of CD45.1 (I, K), CD45.2 (J, L), IgG2a (M, O) and CD45 (N, P) in ischemic tissue in BM-chimeric (I, J, M, N) and non-chimeric mice (K, L, O, P) 24 hours after pMCAO. N.D, none detected. Scale bars: 200 um (A), 10 um (B, C). 50 um (I-P) *P < 0.05, **P < 0.01, and ***P < 0.001.From: Clausen BH, Lambertsen KL, Babcock AA, Holm TH, Dagnaes-Hansen F, Finsen B. Interleukin-1beta and tumor necrosis factor-alpha are expressed by different subsets of microglia and macrophages after ischemic stroke in mice. J Neuroinflammation. 2008 Oct 23;5:46.)
CD11b, Monoclonal Antibody (Cat# AAA12182)
Full Name
RAT ANTI MOUSE CD11b:FITC
Gene Names
Itgam; CR3; CR3A; MAC1; Cd11b; Ly-40; Mac-1; Mac-1a; CD11b/CD18; F730045J24Rik
Applications
FC/FACS
Pricing


 Application Data
(Published customer image Infiltration of GFP+ BM-cells in infarct and peri-infarct regions. (A-B) Dot plots of viable macrophages/granulocytes (CD11b+CD45high, top right quadrants) and microglia (CD11b+CD45dim, bottom right quadrants) in cortex from BM-chimeric unmanipulated mice and mice exposed to pMCAO. (C) Bar graph showing mean numbers of CD11b+CD45dim microglia and CD11b+CD45high macrophages/granulocytes in BM-chimeric mice 24 hours after pMCAO, subdivided based on expression of GFP (n = 5). Approximately 92% of of the CD45high population were GFP+. (D) Estimation and comparison of mean numbers of CD11b+CD45dim microglia in non-chimeric (n = 10) versus BM-chimeric mice (n = 5) 24 hours after of pMCAO shows significantly fewer CD11b+CD45dim microglial cells in irradiated mice. (E) Overview, showing distribution of infiltrating GFP+ BM-derived cells into infarct (IF) and peri-infarct (P-IF) regions 24 hours after pMCAO. (E-G) By 24 hours, GFP+ single cells (F) and vessel-associated aggregates of GFP+ cells (arrows in G) were observed in infarct and peri-infarct regions. Some of the vessel-associated cells were round, leukocyte-like cells (arrows) while others were elongated cells lining the vasculature (arrow heads in G and in insert). (H) Bar graph showing mean numbers of single GFP+ cells and vessel-associated aggregates of GFP+ cells in ipsi- and contralateral cortex 24 hours after surgery (n = 10). (I-P) Immunohistochemical staining of CD45.1 (I, K), CD45.2 (J, L), IgG2a (M, O) and CD45 (N, P) in ischemic tissue in BM-chimeric (I, J, M, N) and non-chimeric mice (K, L, O, P) 24 hours after pMCAO. N.D, none detected. Scale bars: 200 um (A), 10 um (B, C). 50 um (I-P) *P < 0.05, **P < 0.01, and ***P < 0.001.From: Clausen BH, Lambertsen KL, Babcock AA, Holm TH, Dagnaes-Hansen F, Finsen B. Interleukin-1beta and tumor necrosis factor-alpha are expressed by different subsets of microglia and macrophages after ischemic stroke in mice. J Neuroinflammation. 2008 Oct 23;5:46.)
Application Data
(Published customer image Infiltration of GFP+ BM-cells in infarct and peri-infarct regions. (A-B) Dot plots of viable macrophages/granulocytes (CD11b+CD45high, top right quadrants) and microglia (CD11b+CD45dim, bottom right quadrants) in cortex from BM-chimeric unmanipulated mice and mice exposed to pMCAO. (C) Bar graph showing mean numbers of CD11b+CD45dim microglia and CD11b+CD45high macrophages/granulocytes in BM-chimeric mice 24 hours after pMCAO, subdivided based on expression of GFP (n = 5). Approximately 92% of of the CD45high population were GFP+. (D) Estimation and comparison of mean numbers of CD11b+CD45dim microglia in non-chimeric (n = 10) versus BM-chimeric mice (n = 5) 24 hours after of pMCAO shows significantly fewer CD11b+CD45dim microglial cells in irradiated mice. (E) Overview, showing distribution of infiltrating GFP+ BM-derived cells into infarct (IF) and peri-infarct (P-IF) regions 24 hours after pMCAO. (E-G) By 24 hours, GFP+ single cells (F) and vessel-associated aggregates of GFP+ cells (arrows in G) were observed in infarct and peri-infarct regions. Some of the vessel-associated cells were round, leukocyte-like cells (arrows) while others were elongated cells lining the vasculature (arrow heads in G and in insert). (H) Bar graph showing mean numbers of single GFP+ cells and vessel-associated aggregates of GFP+ cells in ipsi- and contralateral cortex 24 hours after surgery (n = 10). (I-P) Immunohistochemical staining of CD45.1 (I, K), CD45.2 (J, L), IgG2a (M, O) and CD45 (N, P) in ischemic tissue in BM-chimeric (I, J, M, N) and non-chimeric mice (K, L, O, P) 24 hours after pMCAO. N.D, none detected. Scale bars: 200 um (A), 10 um (B, C). 50 um (I-P) *P < 0.05, **P < 0.01, and ***P < 0.001.From: Clausen BH, Lambertsen KL, Babcock AA, Holm TH, Dagnaes-Hansen F, Finsen B. Interleukin-1beta and tumor necrosis factor-alpha are expressed by different subsets of microglia and macrophages after ischemic stroke in mice. J Neuroinflammation. 2008 Oct 23;5:46.)
CD11b, Monoclonal Antibody (Cat# AAA12183)
Full Name
RAT ANTI MOUSE CD11b:FITC
Gene Names
Itgam; CR3; CR3A; MAC1; Cd11b; Ly-40; Mac-1; Mac-1a; CD11b/CD18; F730045J24Rik
Applications
FC/FACS
Pricing


 Application Data
(Published customer image Infiltration of GFP+ BM-cells in infarct and peri-infarct regions. (A-B) Dot plots of viable macrophages/granulocytes (CD11b+CD45high, top right quadrants) and microglia (CD11b+CD45dim, bottom right quadrants) in cortex from BM-chimeric unmanipulated mice and mice exposed to pMCAO. (C) Bar graph showing mean numbers of CD11b+CD45dim microglia and CD11b+CD45high macrophages/granulocytes in BM-chimeric mice 24 hours after pMCAO, subdivided based on expression of GFP (n = 5). Approximately 92% of of the CD45high population were GFP+. (D) Estimation and comparison of mean numbers of CD11b+CD45dim microglia in non-chimeric (n = 10) versus BM-chimeric mice (n = 5) 24 hours after of pMCAO shows significantly fewer CD11b+CD45dim microglial cells in irradiated mice. (E) Overview, showing distribution of infiltrating GFP+ BM-derived cells into infarct (IF) and peri-infarct (P-IF) regions 24 hours after pMCAO. (E-G) By 24 hours, GFP+ single cells (F) and vessel-associated aggregates of GFP+ cells (arrows in G) were observed in infarct and peri-infarct regions. Some of the vessel-associated cells were round, leukocyte-like cells (arrows) while others were elongated cells lining the vasculature (arrow heads in G and in insert). (H) Bar graph showing mean numbers of single GFP+ cells and vessel-associated aggregates of GFP+ cells in ipsi- and contralateral cortex 24 hours after surgery (n = 10). (I-P) Immunohistochemical staining of CD45.1 (I, K), CD45.2 (J, L), IgG2a (M, O) and CD45 (N, P) in ischemic tissue in BM-chimeric (I, J, M, N) and non-chimeric mice (K, L, O, P) 24 hours after pMCAO. N.D, none detected. Scale bars: 200 um (A), 10 um (B, C). 50 um (I-P) *P < 0.05, **P < 0.01, and ***P < 0.001.From: Clausen BH, Lambertsen KL, Babcock AA, Holm TH, Dagnaes-Hansen F, Finsen B. Interleukin-1beta and tumor necrosis factor-alpha are expressed by different subsets of microglia and macrophages after ischemic stroke in mice. J Neuroinflammation. 2008 Oct 23;5:46.)
Application Data
(Published customer image Infiltration of GFP+ BM-cells in infarct and peri-infarct regions. (A-B) Dot plots of viable macrophages/granulocytes (CD11b+CD45high, top right quadrants) and microglia (CD11b+CD45dim, bottom right quadrants) in cortex from BM-chimeric unmanipulated mice and mice exposed to pMCAO. (C) Bar graph showing mean numbers of CD11b+CD45dim microglia and CD11b+CD45high macrophages/granulocytes in BM-chimeric mice 24 hours after pMCAO, subdivided based on expression of GFP (n = 5). Approximately 92% of of the CD45high population were GFP+. (D) Estimation and comparison of mean numbers of CD11b+CD45dim microglia in non-chimeric (n = 10) versus BM-chimeric mice (n = 5) 24 hours after of pMCAO shows significantly fewer CD11b+CD45dim microglial cells in irradiated mice. (E) Overview, showing distribution of infiltrating GFP+ BM-derived cells into infarct (IF) and peri-infarct (P-IF) regions 24 hours after pMCAO. (E-G) By 24 hours, GFP+ single cells (F) and vessel-associated aggregates of GFP+ cells (arrows in G) were observed in infarct and peri-infarct regions. Some of the vessel-associated cells were round, leukocyte-like cells (arrows) while others were elongated cells lining the vasculature (arrow heads in G and in insert). (H) Bar graph showing mean numbers of single GFP+ cells and vessel-associated aggregates of GFP+ cells in ipsi- and contralateral cortex 24 hours after surgery (n = 10). (I-P) Immunohistochemical staining of CD45.1 (I, K), CD45.2 (J, L), IgG2a (M, O) and CD45 (N, P) in ischemic tissue in BM-chimeric (I, J, M, N) and non-chimeric mice (K, L, O, P) 24 hours after pMCAO. N.D, none detected. Scale bars: 200 um (A), 10 um (B, C). 50 um (I-P) *P < 0.05, **P < 0.01, and ***P < 0.001.From: Clausen BH, Lambertsen KL, Babcock AA, Holm TH, Dagnaes-Hansen F, Finsen B. Interleukin-1beta and tumor necrosis factor-alpha are expressed by different subsets of microglia and macrophages after ischemic stroke in mice. J Neuroinflammation. 2008 Oct 23;5:46.)
CD11b, Monoclonal Antibody (Cat# AAA12186)
Full Name
RAT ANTI MOUSE CD11b:RPE
Gene Names
Itgam; CR3; CR3A; MAC1; Cd11b; Ly-40; Mac-1; Mac-1a; CD11b/CD18; F730045J24Rik
Applications
FC/FACS
Pricing