Filters
Clonality
Type
Reactivity
Gene Name
Isotype
Host
Application
Clone
44 results for " Tissue Specific Cell Marker" - showing 1-44


 WB (Western Blot)
(Host: RabbitTarget Name: ACTBSample Type: JurkatAntibody Dilution: 1.0ug/mlACTB is strongly supported by BioGPS gene expression data to be expressed in Jurkat)
WB (Western Blot)
(Host: RabbitTarget Name: ACTBSample Type: JurkatAntibody Dilution: 1.0ug/mlACTB is strongly supported by BioGPS gene expression data to be expressed in Jurkat)
ACTB, Polyclonal Antibody (Cat# AAA23467)
Full Name
ACTB Antibody - middle region
Gene Names
ACTB; BRWS1; PS1TP5BP1
Reactivity
Cow, Goat, Horse, Human, Mouse, Pig, Rat, Sheep, Zebrafish
Applications
IHC, WB
Purity
Affinity Purified
Pricing
 Standard Curve (Sample)
kallikrein-related peptidase 3, ELISA Kit (Cat# AAA15354)
Full Name
Human prostate specific antigen, PSA ELISA Kit
Gene Names
KLK3; APS; PSA; hK3; KLK2A1
Reactivity
Human
Pricing


 Application Data
(Surface Plasmon Resonance Kinetic Characterization of Polyclonal Antibody Affinity. Purified polyclonal antibodies were immobilized on a Protein A/G coated Carterra LSA sensor chip at concentrations of 5, and 50 ug/mL in duplicate. Antibodies on the surface were exposed to interaction with peptides sequentially via microfluidic controlled flow at 333nM peptide concentration for kinetic characterization of the binders for affinity and specificity, followed by curve fitting using the Kinetics software. Kd determinations for both concentrations were averaged and results and standard deviation are shown.)
Application Data
(Surface Plasmon Resonance Kinetic Characterization of Polyclonal Antibody Affinity. Purified polyclonal antibodies were immobilized on a Protein A/G coated Carterra LSA sensor chip at concentrations of 5, and 50 ug/mL in duplicate. Antibodies on the surface were exposed to interaction with peptides sequentially via microfluidic controlled flow at 333nM peptide concentration for kinetic characterization of the binders for affinity and specificity, followed by curve fitting using the Kinetics software. Kd determinations for both concentrations were averaged and results and standard deviation are shown.)
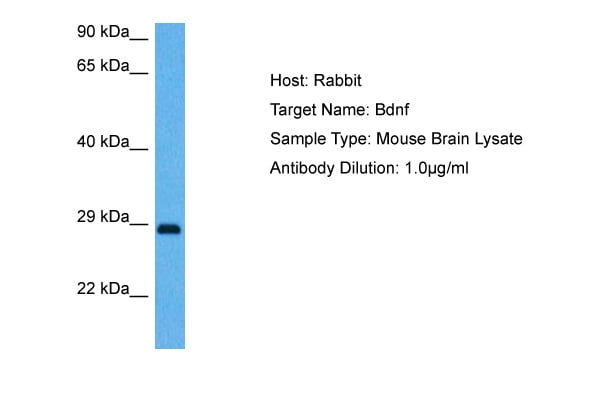
BDNF, Polyclonal Antibody (Cat# AAA23497)
Full Name
BDNF antibody - middle region
Gene Names
BDNF; ANON2; BULN2
Reactivity
Tested Species Reactivity: Human, Mouse, Monkey
Predicted Species Reactivity: Human, Mouse, Rat, Dog, Horse, Pig, Rabbit
Predicted Species Reactivity: Human, Mouse, Rat, Dog, Horse, Pig, Rabbit
Applications
IHC, WB
Purity
Affinity Purified
Pricing


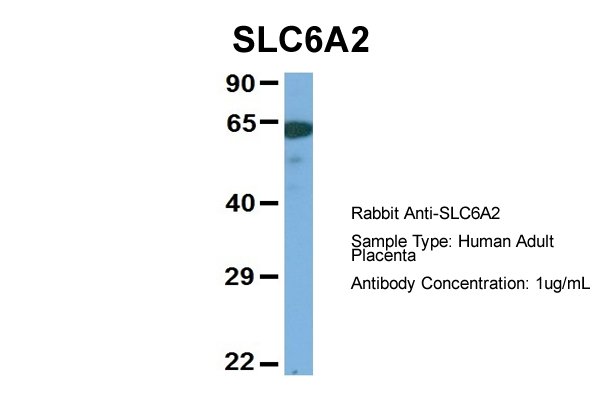


 WB (Western Blot)
(WB Suggested Anti-SLC6A2 Antibody Titration: 0.2-1 ug/mlELISA Titer: 1:312500Positive Control: Human heart)
WB (Western Blot)
(WB Suggested Anti-SLC6A2 Antibody Titration: 0.2-1 ug/mlELISA Titer: 1:312500Positive Control: Human heart)
SLC6A2, Polyclonal Antibody (Cat# AAA23496)
Full Name
SLC6A2 antibody - middle region
Gene Names
SLC6A2; NET; NAT1; NET1; SLC6A5
Reactivity
Cow, Dog, Guinea Pig, Horse, Human, Mouse, Rabbit, Rat
Applications
WB
Purity
Affinity Purified
Pricing


 WB (Western Blot)
(WB Suggested Anti-KRT8 Antibody Titration: 0.2-1 ug/mlPositive Control: HepG2 cell lysateKRT8 is supported by BioGPS gene expression data to be expressed in HepG2)
WB (Western Blot)
(WB Suggested Anti-KRT8 Antibody Titration: 0.2-1 ug/mlPositive Control: HepG2 cell lysateKRT8 is supported by BioGPS gene expression data to be expressed in HepG2)
KRT8, Polyclonal Antibody (Cat# AAA23499)
Full Name
KRT8 antibody - middle region
Gene Names
KRT8; K8; KO; CK8; CK-8; CYK8; K2C8; CARD2
Reactivity
Cow, Dog, Guinea Pig, Horse, Human, Mouse, Pig, Rabbit, Rat
Applications
WB, IHC
Purity
Affinity Purified
Pricing


 WB (Western Blot)
(WB Suggested Anti-KRT8 Antibody Titration: 0.2-1 ug/mlPositive Control: Jurkat cell lysate)
WB (Western Blot)
(WB Suggested Anti-KRT8 Antibody Titration: 0.2-1 ug/mlPositive Control: Jurkat cell lysate)
KRT8, Polyclonal Antibody (Cat# AAA23498)
Full Name
KRT8 Antibody
Gene Names
KRT8; K8; KO; CK8; CK-8; CYK8; K2C8; CARD2
Reactivity
Cow, Dog, Guinea Pig, Horse, Human, Mouse, Rat, Yeast
Applications
WB, IHC
Purity
Affinity Purified
Pricing


 SDS-PAGE
(SDS-PAGE Analysis Purified Cytokeratin-7 Mouse Monoclonal Antibody (KRT7/2200). Confirmation of Integrity and Purity of Antibody.)
SDS-PAGE
(SDS-PAGE Analysis Purified Cytokeratin-7 Mouse Monoclonal Antibody (KRT7/2200). Confirmation of Integrity and Purity of Antibody.)
Cytokeratin 7, Monoclonal Antibody (Cat# AAA23922)
Full Name
Cytokeratin 7 (Glandular and Transitional Epithelial Marker)
Gene Names
KRT7; K7; CK7; SCL; K2C7
Reactivity
Human
Applications
WB, IHC
Purity
Purified Ab with BSA and Azide at 200ug/ml OR Purified Ab WITHOUT BSA and Azide at 1.0mg/ml
Pricing
 SDS-PAGE
(SDS-PAGE Analysis Purified Secretory Component Mouse Monoclonal Antibody (SPM217). Confirmation of Purity and Integrity of Antibody.)
SDS-PAGE
(SDS-PAGE Analysis Purified Secretory Component Mouse Monoclonal Antibody (SPM217). Confirmation of Purity and Integrity of Antibody.)
IgA Secretory Component / ECM1, Monoclonal Antibody (Cat# AAA13802)
Full Name
IgA Secretory Component / ECM1 Mouse Monoclonal Antibody
Gene Names
ECM1; URBWD
Reactivity
Human, Rat
Applications
FC/FACS, IF, IHC
Pricing


 WB (Western Blot)
(WB Suggested Anti-MMP1 Antibody Titration: 1.25ug/mlPositive Control: Jurkat cell lysate)
WB (Western Blot)
(WB Suggested Anti-MMP1 Antibody Titration: 1.25ug/mlPositive Control: Jurkat cell lysate)
MMP1, Polyclonal Antibody (Cat# AAA23500)
Full Name
MMP1 antibody - N-terminal region
Gene Names
MMP1; CLG; CLGN
Reactivity
Horse, Human
Applications
IHC, WB
Purity
Protein A purified
Pricing


 IF (Immunofluorescence)
MSH2, Monoclonal Antibody (Cat# AAA23925)
Full Name
MSH2 (DNA Mismatch Repair Marker)
Gene Names
MSH2; FCC1; COCA1; HNPCC; LCFS2; hMSH2; HNPCC1
Reactivity
Human
Applications
FC, WB, IHC
Purity
Purified
Pricing
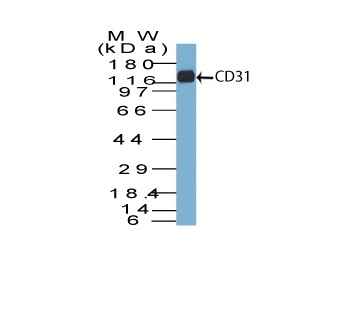


 WB (Western Blot)
(Western Blot Analysis of human Jurkat cell lysate using CD31 Mouse Monoclonal Antibody (C31.7).)
WB (Western Blot)
(Western Blot Analysis of human Jurkat cell lysate using CD31 Mouse Monoclonal Antibody (C31.7).)
CD31 / PECAM-1, Monoclonal Antibody (Cat# AAA13801)
Full Name
CD31 / PECAM-1 (Endothelial Cell Marker) Mouse Monoclonal Antibody
Gene Names
PECAM1; CD31; PECA1; GPIIA'; PECAM-1; endoCAM; CD31/EndoCAM
Reactivity
Human, Cynomolgus Monkey, Rabbit.
Weakly reacts with Rat
Weakly reacts with Rat
Applications
FC/FACS, IF, WB, IHC
Pricing


 IHC (Immunohistochemistry)
(Formalin-fixed, paraffin-embedded Rat Skeletal Muscle stained with Muscle Specific Actin Monoclonal Antibody (MSA/953))
IHC (Immunohistochemistry)
(Formalin-fixed, paraffin-embedded Rat Skeletal Muscle stained with Muscle Specific Actin Monoclonal Antibody (MSA/953))
Actin, Monoclonal Antibody (Cat# AAA13822)
Full Name
Actin, Muscle Specific (Muscle Cell Marker) Mouse Monoclonal Antibody
Gene Names
ACTA2; AAT6; ACTSA; MYMY5
Reactivity
Human, Rabbit, Rat
Applications
FC/FACS, IF, WB, IHC
Pricing


 SDS-PAGE
(SDS-PAGE Analysis Purified ATG5 Mouse Monoclonal Antibody (ATG5/2492). Confirmation of Purity and Integrity of Antibody.)
SDS-PAGE
(SDS-PAGE Analysis Purified ATG5 Mouse Monoclonal Antibody (ATG5/2492). Confirmation of Purity and Integrity of Antibody.)
ATG5, Monoclonal Antibody (Cat# AAA23947)
Full Name
ATG5 (Autophagy Marker)
Gene Names
ATG5; ASP; APG5; APG5L; hAPG5; SCAR25; APG5-LIKE
Reactivity
Human
Applications
EIA, WB, IHC
Purity
Purified Ab with BSA and Azide at 200ug/ml OR Purified Ab WITHOUT BSA and Azide at 1.0mg/ml
Pricing
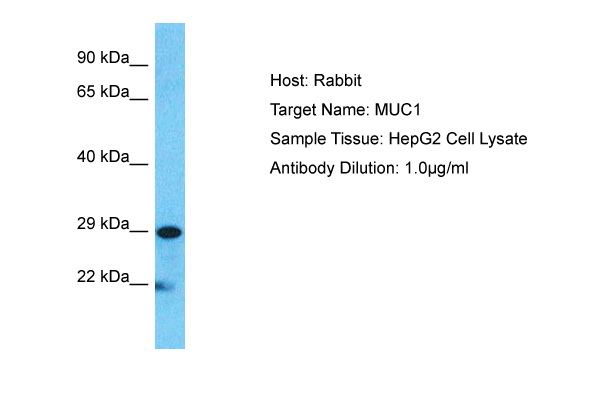


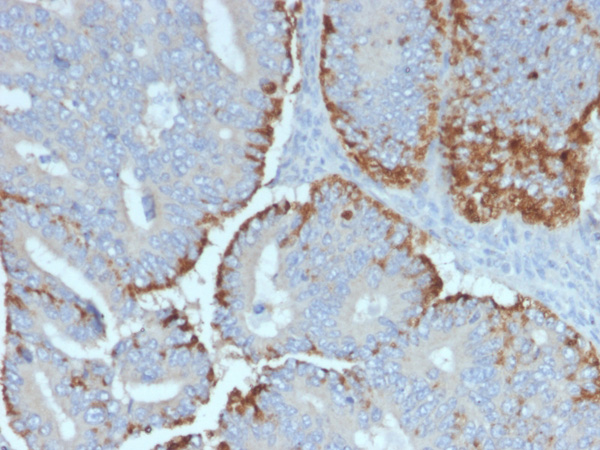
 WB (Western Blot)
(Host: RabbitTarget Name: MUC1Sample Type: HepG2Lane A: Primary AntibodyLane B: Primary Antibody + Blocking PeptidePrimary Antibody Concentration: 1ug/mlPeptide Concentration: 5ug/mlLysate Quantity: 25ug/lane/laneGel Concentration: 0.12)
WB (Western Blot)
(Host: RabbitTarget Name: MUC1Sample Type: HepG2Lane A: Primary AntibodyLane B: Primary Antibody + Blocking PeptidePrimary Antibody Concentration: 1ug/mlPeptide Concentration: 5ug/mlLysate Quantity: 25ug/lane/laneGel Concentration: 0.12)
MUC1, Polyclonal Antibody (Cat# AAA23492)
Full Name
MUC1 antibody - C-terminal region
Gene Names
MUC1; EMA; MCD; PEM; PUM; KL-6; MAM6; MCKD; PEMT; CD227; H23AG; MCKD1; MUC-1; ADMCKD; ADMCKD1; CA 15-3; MUC-1/X; MUC1/ZD; MUC-1/SEC
Reactivity
Cow, Dog, Guinea Pig, Horse, Human, Mouse, Rabbit, Rat, Pig
Applications
IHC, WB
Purity
Affinity Purified
Pricing


 WB (Western Blot)
(Western Blot Analysis of Panc-1 cell lysate using S100A4 Recombinant Mouse Monoclonal Antibody (rS100A4/1481).)
WB (Western Blot)
(Western Blot Analysis of Panc-1 cell lysate using S100A4 Recombinant Mouse Monoclonal Antibody (rS100A4/1481).)
S100A4/Metastasin/Calvasculin, Antibody (Cat# AAA23934)
Full Name
S100A4/Metastasin/Calvasculin (Marker of Tumor Metastasis)
Gene Names
S100A4; 42A; 18A2; CAPL; FSP1; MTS1; P9KA; PEL98
Reactivity
Human, Mouse
Applications
FC/FACS, WB, IF, IHC
Purity
Purified Ab with BSA and Azide at 200ug/ml OR Purified Ab WITHOUT BSA and Azide at 1.0mg/ml
Pricing


 Application Data
Ep-CAM /CD326, Monoclonal Antibody (Cat# AAA13831)
Full Name
Ep-CAM /CD326 (Epithelial Marker) Mouse Monoclonal Antibody
Gene Names
EPCAM; ESA; KSA; M4S1; MK-1; DIAR5; EGP-2; EGP40; KS1/4; MIC18; TROP1; EGP314; HNPCC8; TACSTD1
Reactivity
Human, Mouse, Rat
Applications
FC/FACS, IF, WB, IHC
Pricing


 Application Data
(Analysis of Protein Array containing more than 19, 000 full-length human proteins using Mouse Emerin Monoclonal Antibody (EMD/2168) Z- and S- Score: The Z-score represents the strength of a signal that a monoclonal antibody (MAb) (in combination with a fluorescently-tagged anti-IgG secondary antibody) produces when binding to a particular protein on the HuProtTM array. Z-scores are described in units of standard deviations (SD's) above the mean value of all signals generated on that array. If targets on HuProtTM are arranged in descending order of the Z-score, the S-score is the difference (also in units of SD's) between the Z-score. S-score therefore represents the relative target specificity of a MAb to its intended target. A MAb is considered to specific to its intended target, if the MAb has an S-score of at least 2.5. For example, if a MAb binds to protein X with a Z-score of 43 and to protein Y with a Z-score of 14, then the S-score for the binding of that MAb to protein X is equal to 29.)
Application Data
(Analysis of Protein Array containing more than 19, 000 full-length human proteins using Mouse Emerin Monoclonal Antibody (EMD/2168) Z- and S- Score: The Z-score represents the strength of a signal that a monoclonal antibody (MAb) (in combination with a fluorescently-tagged anti-IgG secondary antibody) produces when binding to a particular protein on the HuProtTM array. Z-scores are described in units of standard deviations (SD's) above the mean value of all signals generated on that array. If targets on HuProtTM are arranged in descending order of the Z-score, the S-score is the difference (also in units of SD's) between the Z-score. S-score therefore represents the relative target specificity of a MAb to its intended target. A MAb is considered to specific to its intended target, if the MAb has an S-score of at least 2.5. For example, if a MAb binds to protein X with a Z-score of 43 and to protein Y with a Z-score of 14, then the S-score for the binding of that MAb to protein X is equal to 29.)
Emerin, Monoclonal Antibody (Cat# AAA23899)
Full Name
Emerin (Papillary Thyroid Carcinoma and EDMD Marker)
Gene Names
EMD; STA; EDMD; LEMD5
Reactivity
Human. Others not known.
Applications
IHC
Pricing


 IF (Immunofluorescence)
(Confocal Immunofluorescent analysis of SK-OV-3 cells using AF488-labeled Isotype Control Monoclonal Antibody (IgG1) (Green).DAPI was used to stain the cell nuclei (blue). (Negative Control))
IF (Immunofluorescence)
(Confocal Immunofluorescent analysis of SK-OV-3 cells using AF488-labeled Isotype Control Monoclonal Antibody (IgG1) (Green).DAPI was used to stain the cell nuclei (blue). (Negative Control))
Ep-CAM /CD326, Monoclonal Antibody (Cat# AAA13838)
Full Name
Ep-CAM /CD326 (Epithelial Marker) Mouse Monoclonal Antibody
Gene Names
EPCAM; ESA; KSA; M4S1; MK-1; DIAR5; EGP-2; EGP40; KS1/4; MIC18; TROP1; EGP314; HNPCC8; TACSTD1
Reactivity
Human.
Does not react with Mouse and Rat
Does not react with Mouse and Rat
Applications
FC/FACS, IF, WB, IHC
Pricing


 SDS-PAGE
(SDS-PAGE Analysis Purified with Nucleolin Monoclonal Antibody (364-5). Confirmation of Integrity and Purity of Antibody)
SDS-PAGE
(SDS-PAGE Analysis Purified with Nucleolin Monoclonal Antibody (364-5). Confirmation of Integrity and Purity of Antibody)
Nucleolin, Monoclonal Antibody (Cat# AAA13835)
Full Name
Nucleolin (Marker of Human Cells) Mouse Monoclonal Antibody
Gene Names
NCL; C23
Reactivity
Does not react with Mouse, Human, Rat and Cow
Applications
FC/FACS, IF, WB, IHC
Pricing


 WB (Western Blot)
(Western Blot Analysis of human liver tissue lysate using Prohibitin Mouse Monoclonal Antibody (PHB/3194).)
WB (Western Blot)
(Western Blot Analysis of human liver tissue lysate using Prohibitin Mouse Monoclonal Antibody (PHB/3194).)
Prohibitin, Monoclonal Antibody (Cat# AAA23932)
Full Name
Prohibitin (Mitochondrial Marker)
Gene Names
PHB; PHB1; HEL-215; HEL-S-54e
Reactivity
Human
Applications
WB, IF, IHC
Purity
Purified Ab with BSA and Azide at 200ug/ml OR Purified Ab WITHOUT BSA and Azide at 1.0mg/ml
Pricing


 Application Data
(Analysis of Protein Array containing more than 19, 000 full-length human proteins using Mouse Emerin Monoclonal Antibody (EMD/2167) Z- and S- Score: The Z-score represents the strength of a signal that a monoclonal antibody (MAb) (in combination with a fluorescently-tagged anti-IgG secondary antibody) produces when binding to a particular protein on the HuProtTM array. Z-scores are described in units of standard deviations (SD's) above the mean value of all signals generated on that array. If targets on HuProtTM are arranged in descending order of the Z-score, the S-score is the difference (also in units of SD's) between the Z-score. S-score therefore represents the relative target specificity of a MAb to its intended target. A MAb is considered to specific to its intended target, if the MAb has an S-score of at least 2.5. For example, if a MAb binds to protein X with a Z-score of 43 and to protein Y with a Z-score of 14, then the S-score for the binding of that MAb to protein X is equal to 29.)
Application Data
(Analysis of Protein Array containing more than 19, 000 full-length human proteins using Mouse Emerin Monoclonal Antibody (EMD/2167) Z- and S- Score: The Z-score represents the strength of a signal that a monoclonal antibody (MAb) (in combination with a fluorescently-tagged anti-IgG secondary antibody) produces when binding to a particular protein on the HuProtTM array. Z-scores are described in units of standard deviations (SD's) above the mean value of all signals generated on that array. If targets on HuProtTM are arranged in descending order of the Z-score, the S-score is the difference (also in units of SD's) between the Z-score. S-score therefore represents the relative target specificity of a MAb to its intended target. A MAb is considered to specific to its intended target, if the MAb has an S-score of at least 2.5. For example, if a MAb binds to protein X with a Z-score of 43 and to protein Y with a Z-score of 14, then the S-score for the binding of that MAb to protein X is equal to 29.)
Emerin, Monoclonal Antibody (Cat# AAA23898)
Full Name
Emerin (Papillary Thyroid Carcinoma and EDMD Marker)
Gene Names
EMD; STA; EDMD; LEMD5
Reactivity
Human. Others not known.
Applications
IHC
Pricing


 Application Data
(Analysis of Protein Array containing more than 19, 000 full-length human proteins using Mesothelin Mouse Monoclonal Antibody (MSLN/2131). Z- and S- Score: The Z-score represents the strength of a signal that a monoclonal antibody (MAb) (in combination with a fluorescently-tagged anti-IgG secondary antibody) produces when binding to a particular protein on the HuProtTM array. Z-scores are described in units of standard deviations (SD's) above the mean value of all signals generated on that array. If targets on HuProtTM are arranged in descending order of the Z-score, the S-score is the difference (also in units of SD's) between the Z-score. S-score therefore represents the relative target specificity of a MAb to its intended target. A MAb is considered to specific to its intended target, if the MAb has an S-score of at least 2.5. For example, if a MAb binds to protein X with a Z-score of 43 and to protein Y with a Z-score of 14, then the S-score for the binding of that MAb to protein X is equal to 29.)
Application Data
(Analysis of Protein Array containing more than 19, 000 full-length human proteins using Mesothelin Mouse Monoclonal Antibody (MSLN/2131). Z- and S- Score: The Z-score represents the strength of a signal that a monoclonal antibody (MAb) (in combination with a fluorescently-tagged anti-IgG secondary antibody) produces when binding to a particular protein on the HuProtTM array. Z-scores are described in units of standard deviations (SD's) above the mean value of all signals generated on that array. If targets on HuProtTM are arranged in descending order of the Z-score, the S-score is the difference (also in units of SD's) between the Z-score. S-score therefore represents the relative target specificity of a MAb to its intended target. A MAb is considered to specific to its intended target, if the MAb has an S-score of at least 2.5. For example, if a MAb binds to protein X with a Z-score of 43 and to protein Y with a Z-score of 14, then the S-score for the binding of that MAb to protein X is equal to 29.)
Mesothelin, Monoclonal Antibody (Cat# AAA23897)
Full Name
Mesothelin (Mesothelial Marker)
Gene Names
MSLN; MPF; SMRP
Reactivity
Human, Mouse, Rat. Others not known.
Applications
IHC
Pricing


 Application Data
(Analysis of Protein Array containing >19, 000 full-length human proteins using TACSTD2 Mouse Monoclonal Antibody (TACSTD2/2153) Z- and S- Score: The Z-score represents the strength of a signal that a monoclonal antibody (MAb) (in combination with a fluorescently-tagged anti-IgG secondary antibody) produces when binding to a particular protein on the HuProtTM array. Z-scores are described in units of standard deviations (SD's) above the mean value of all signals generated on that array. If targets on HuProtTM are arranged in descending order of the Z-score, the S-score is the difference (also in units of SD's) between the Z-score. S-score therefore represents the relative target specificity of a MAb to its intended target. A MAb is considered to specific to its intended target, if the MAb has an S-score of at least 2.5. For example, if a MAb binds to protein X with a Z-score of 43 and to protein Y with a Z-score of 14, then the S-score for the binding of that MAb to protein X is equal to 29.)
Application Data
(Analysis of Protein Array containing >19, 000 full-length human proteins using TACSTD2 Mouse Monoclonal Antibody (TACSTD2/2153) Z- and S- Score: The Z-score represents the strength of a signal that a monoclonal antibody (MAb) (in combination with a fluorescently-tagged anti-IgG secondary antibody) produces when binding to a particular protein on the HuProtTM array. Z-scores are described in units of standard deviations (SD's) above the mean value of all signals generated on that array. If targets on HuProtTM are arranged in descending order of the Z-score, the S-score is the difference (also in units of SD's) between the Z-score. S-score therefore represents the relative target specificity of a MAb to its intended target. A MAb is considered to specific to its intended target, if the MAb has an S-score of at least 2.5. For example, if a MAb binds to protein X with a Z-score of 43 and to protein Y with a Z-score of 14, then the S-score for the binding of that MAb to protein X is equal to 29.)
TACSTD2/TROP2, Monoclonal Antibody (Cat# AAA23900)
Full Name
TACSTD2/TROP2 (Epithelial Marker)
Gene Names
TACSTD2; EGP1; GP50; M1S1; EGP-1; TROP2; GA7331; GA733-1
Reactivity
Human. Others not known.
Applications
IHC
Pricing


 Application Data
(Analysis of Protein Array containing more than 19,000 full-length human proteins using ERCC1 Mouse Monoclonal Antibody (ERCC1/2318). Z- and S- Score: The Z-score represents the strength of a signal that a monoclonal antibody (MAb) (in combination with a fluorescently-tagged anti-IgG secondary antibody) produces when binding to a particular protein on the HuProtTM array. Z-scores are described in units of standard deviations (SD's) above the mean value of all signals generated on that array. If targets on HuProtTM are arranged in descending order of the Z-score, the S-score is the difference (also in units of SD's) between the Z-score. S-score therefore represents the relative target specificity of a MAb to its intended target. A MAb is considered to specific to its intended target, if the MAb has an S-score of at least 2.5. For example, if a MAb binds to protein X with a Z-score of 43 and to protein Y with a Z-score of 14, then the S-score for the binding of that MAb to protein X is equal to 29.)
Application Data
(Analysis of Protein Array containing more than 19,000 full-length human proteins using ERCC1 Mouse Monoclonal Antibody (ERCC1/2318). Z- and S- Score: The Z-score represents the strength of a signal that a monoclonal antibody (MAb) (in combination with a fluorescently-tagged anti-IgG secondary antibody) produces when binding to a particular protein on the HuProtTM array. Z-scores are described in units of standard deviations (SD's) above the mean value of all signals generated on that array. If targets on HuProtTM are arranged in descending order of the Z-score, the S-score is the difference (also in units of SD's) between the Z-score. S-score therefore represents the relative target specificity of a MAb to its intended target. A MAb is considered to specific to its intended target, if the MAb has an S-score of at least 2.5. For example, if a MAb binds to protein X with a Z-score of 43 and to protein Y with a Z-score of 14, then the S-score for the binding of that MAb to protein X is equal to 29.)
ERCC1/RAD10, Monoclonal Antibody (Cat# AAA23913)
Full Name
ERCC1/RAD10 (Tumor Progression Marker)
Gene Names
ERCC1; UV20; COFS4; RAD10
Reactivity
Human
Applications
IHC
Purity
Purified Ab with BSA and Azide at 200ug/ml OR Purified Ab WITHOUT BSA and Azide at 1.0mg/ml
Pricing


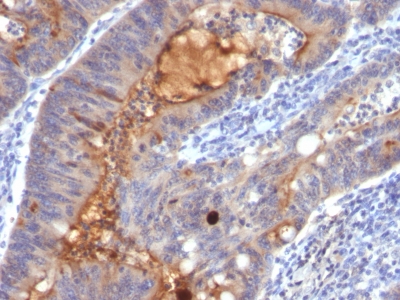
 IHC (Immunohistchemistry)
(Figure 6. IHC analysis of Musashi 1/Msi1 using anti- Musashi 1/Msi1 antibody (AAA19172).Musashi 1/Msi1 was detected in paraffin-embedded section of human mammary cancer tissues. Heat mediated antigen retrieval was performed in citrate buffer (pH6, epitope retrieval solution) for 20 mins. The tissue section was blocked with 10% goat serum. The tissue section was then incubated with 1ug/ml rabbit anti- Musashi 1/Msi1 Antibody (AAA19172) overnight at 4 degree C. Biotinylated goat anti-rabbit IgG was used as secondary antibody and incubated for 30 minutes at 37 degree C. The tissue section was developed using Strepavidin-Biotin-Complex (SABC) with DAB as the chromogen.)
IHC (Immunohistchemistry)
(Figure 6. IHC analysis of Musashi 1/Msi1 using anti- Musashi 1/Msi1 antibody (AAA19172).Musashi 1/Msi1 was detected in paraffin-embedded section of human mammary cancer tissues. Heat mediated antigen retrieval was performed in citrate buffer (pH6, epitope retrieval solution) for 20 mins. The tissue section was blocked with 10% goat serum. The tissue section was then incubated with 1ug/ml rabbit anti- Musashi 1/Msi1 Antibody (AAA19172) overnight at 4 degree C. Biotinylated goat anti-rabbit IgG was used as secondary antibody and incubated for 30 minutes at 37 degree C. The tissue section was developed using Strepavidin-Biotin-Complex (SABC) with DAB as the chromogen.)
Musashi 1/Msi1, Polyclonal Antibody (Cat# AAA19172)
Full Name
Anti-Musashi 1/Msi1 Picoband Antibody
Reactivity
Human, Mouse, Rat
No cross reactivity with other proteins
No cross reactivity with other proteins
Applications
IHC, WB
Purity
Immunogen affinity purified
Pricing


 Application Data
(Analysis of Protein Array containing more than 19,000 full-length human proteins using AMACR/p504S Mouse Monoclonal Antibody (AMACR/1864). Z- and S- Score: The Z-score represents the strength of a signal that a monoclonal antibody (MAb) (in combination with a fluorescently-tagged anti-IgG secondary antibody) produces when binding to a particular protein on the HuProtTM array. Z-scores are described in units of standard deviations (SD's) above the mean value of all signals generated on that array. If targets on HuProtTM are arranged in descending order of the Z-score, the S-score is the difference (also in units of SD's) between the Z-score. S-score therefore represents the relative target specificity of a MAb to its intended target. A MAb is considered to specific to its intended target, if the MAb has an S-score of at least 2.5. For example, if a MAb binds to protein X with a Z-score of 43 and to protein Y with a Z-score of 14, then the S-score for the binding of that MAb to protein X is equal to 29.)
Application Data
(Analysis of Protein Array containing more than 19,000 full-length human proteins using AMACR/p504S Mouse Monoclonal Antibody (AMACR/1864). Z- and S- Score: The Z-score represents the strength of a signal that a monoclonal antibody (MAb) (in combination with a fluorescently-tagged anti-IgG secondary antibody) produces when binding to a particular protein on the HuProtTM array. Z-scores are described in units of standard deviations (SD's) above the mean value of all signals generated on that array. If targets on HuProtTM are arranged in descending order of the Z-score, the S-score is the difference (also in units of SD's) between the Z-score. S-score therefore represents the relative target specificity of a MAb to its intended target. A MAb is considered to specific to its intended target, if the MAb has an S-score of at least 2.5. For example, if a MAb binds to protein X with a Z-score of 43 and to protein Y with a Z-score of 14, then the S-score for the binding of that MAb to protein X is equal to 29.)
AMACR/p504S, Monoclonal Antibody (Cat# AAA23906)
Full Name
AMACR/p504S (Prostate Cancer Marker)
Gene Names
AMACR; RM; RACE; CBAS4; P504S; AMACRD
Reactivity
Human. Others not known.
Applications
WB, Formalin-Fixed
Purity
Purified Ab with BSA and Azide at 200ug/ml OR Purified Ab WITHOUT BSA and Azide at 1.0mg/ml
Pricing

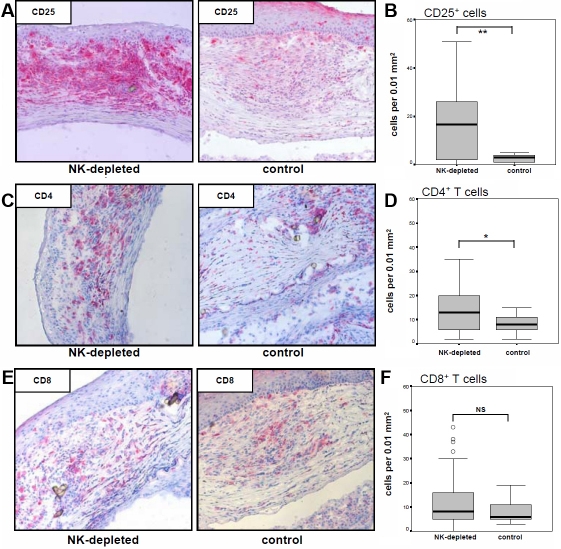


 Application Data
(Immunoperoxidase staining of rat lymph node cryosection with Mouse anti Rat CD25 followed by horseradish peroxidase conjugated Goat anti Mouse IgG1 as a detection reagent. High power)
Application Data
(Immunoperoxidase staining of rat lymph node cryosection with Mouse anti Rat CD25 followed by horseradish peroxidase conjugated Goat anti Mouse IgG1 as a detection reagent. High power)
CD25, Monoclonal Antibody (Cat# AAA12044)
Full Name
MOUSE ANTI RAT CD25:RPE
Gene Names
Il2ra; IL2RAC
Applications
FC/FACS
Pricing


 Application Data
(Analysis of Protein Array containing more than 19, 000 full-length human proteins using PU.1 Mouse Monoclonal Antibody (PU1/2446). Z- and S- Score: The Z-score represents the strength of a signal that a monoclonal antibody (MAb) (in combination with a fluorescently-tagged anti-IgG secondary antibody) produces when binding to a particular protein on the HuProtTM array. Z-scores are described in units of standard deviations (SD's) above the mean value of all signals generated on that array. If targets on HuProtTM are arranged in descending order of the Z-score, the S-score is the difference (also in units of SD's) between the Z-score. S-score therefore represents the relative target specificity of a MAb to its intended target. A MAb is considered to specific to its intended target, if the MAb has an S-score of at least 2.5. For example, if a MAb binds to protein X with a Z-score of 43 and to protein Y with a Z-score of 14, then the S-score for the binding of that MAb to protein X is equal to 29.)
Application Data
(Analysis of Protein Array containing more than 19, 000 full-length human proteins using PU.1 Mouse Monoclonal Antibody (PU1/2446). Z- and S- Score: The Z-score represents the strength of a signal that a monoclonal antibody (MAb) (in combination with a fluorescently-tagged anti-IgG secondary antibody) produces when binding to a particular protein on the HuProtTM array. Z-scores are described in units of standard deviations (SD's) above the mean value of all signals generated on that array. If targets on HuProtTM are arranged in descending order of the Z-score, the S-score is the difference (also in units of SD's) between the Z-score. S-score therefore represents the relative target specificity of a MAb to its intended target. A MAb is considered to specific to its intended target, if the MAb has an S-score of at least 2.5. For example, if a MAb binds to protein X with a Z-score of 43 and to protein Y with a Z-score of 14, then the S-score for the binding of that MAb to protein X is equal to 29.)
PU.1 (SPI-1), Monoclonal Antibody (Cat# AAA23903)
Full Name
PU.1 (SPI-1) (B-Cell Marker)
Gene Names
SPI1; OF; PU.1; SFPI1; SPI-1; SPI-A
Reactivity
Human. Others not known.
Applications
WB, IHC
Pricing


 Application Data
(Analysis of Protein Array containing more than 19,000 full-length human proteins using Cytokeratin 15 Mouse Monoclonal Antibody (KRT15/2959). Z- and S- Score: The Z-score represents the strength of a signal that a monoclonal antibody (MAb) (in combination with a fluorescently-tagged anti-IgG secondary antibody) produces when binding to a particular protein on the HuProtTM array. Z-scores are described in units of standard deviations (SD's) above the mean value of all signals generated on that array. If targets on HuProtTM are arranged in descending order of the Z-score, the S-score is the difference (also in units of SD's) between the Z-score. S-score therefore represents the relative target specificity of a MAb to its intended target. A MAb is considered to specific to its intended target, if the MAb has an S-score of at least 2.5. For example, if a MAb binds to protein X with a Z-score of 43 and to protein Y with a Z-score of 14, then the S-score for the binding of that MAb to protein X is equal to 29.)
Application Data
(Analysis of Protein Array containing more than 19,000 full-length human proteins using Cytokeratin 15 Mouse Monoclonal Antibody (KRT15/2959). Z- and S- Score: The Z-score represents the strength of a signal that a monoclonal antibody (MAb) (in combination with a fluorescently-tagged anti-IgG secondary antibody) produces when binding to a particular protein on the HuProtTM array. Z-scores are described in units of standard deviations (SD's) above the mean value of all signals generated on that array. If targets on HuProtTM are arranged in descending order of the Z-score, the S-score is the difference (also in units of SD's) between the Z-score. S-score therefore represents the relative target specificity of a MAb to its intended target. A MAb is considered to specific to its intended target, if the MAb has an S-score of at least 2.5. For example, if a MAb binds to protein X with a Z-score of 43 and to protein Y with a Z-score of 14, then the S-score for the binding of that MAb to protein X is equal to 29.)
Cytokeratin 15, Monoclonal Antibody (Cat# AAA23924)
Full Name
Cytokeratin 15 (Esophageal Squamous Cell Carcinoma Marker)
Gene Names
KRT15; K15; CK15; K1CO
Reactivity
Human
Applications
IF, WB, IHC
Purity
Purified Ab with BSA and Azide at 200ug/ml OR Purified Ab WITHOUT BSA and Azide at 1.0mg/ml
Pricing


 WB (Western Blot)
(Western Blot Analysis of human liver tissue lysate using Prohibitin Mouse Monoclonal Antibody (PHB/3225).)
WB (Western Blot)
(Western Blot Analysis of human liver tissue lysate using Prohibitin Mouse Monoclonal Antibody (PHB/3225).)
Prohibitin, Monoclonal Antibody (Cat# AAA23933)
Full Name
Prohibitin (Mitochondrial Marker)
Gene Names
PHB; PHB1; HEL-215; HEL-S-54e
Reactivity
Human
Applications
WB, IF, IHC
Purity
Purified Ab with BSA and Azide at 200ug/ml OR Purified Ab WITHOUT BSA and Azide at 1.0mg/ml
Pricing


 Application Data
(Analysis of Protein Array containing >19, 000 full-length human proteins using EpCAM Mouse Monoclonal Antibody (EGP40/1372) Z- and S- Score: The Z-score represents the strength of a signal that a monoclonal antibody (MAb) (in combination with a fluorescently-tagged anti-IgG secondary antibody) produces when binding to a particular protein on the HuProtTM array. Z-scores are described in units of standard deviations (SD's) above the mean value of all signals generated on that array. If targets on HuProtTM are arranged in descending order of the Z-score, the S-score is the difference (also in units of SD's) between the Z-score. S-score therefore represents the relative target specificity of a MAb to its intended target. A MAb is considered to specific to its intended target, if the MAb has an S-score of at least 2.5. For example, if a MAb binds to protein X with a Z-score of 43 and to protein Y with a Z-score of 14, then the S-score for the binding of that MAb to protein X is equal to 29.)
Application Data
(Analysis of Protein Array containing >19, 000 full-length human proteins using EpCAM Mouse Monoclonal Antibody (EGP40/1372) Z- and S- Score: The Z-score represents the strength of a signal that a monoclonal antibody (MAb) (in combination with a fluorescently-tagged anti-IgG secondary antibody) produces when binding to a particular protein on the HuProtTM array. Z-scores are described in units of standard deviations (SD's) above the mean value of all signals generated on that array. If targets on HuProtTM are arranged in descending order of the Z-score, the S-score is the difference (also in units of SD's) between the Z-score. S-score therefore represents the relative target specificity of a MAb to its intended target. A MAb is considered to specific to its intended target, if the MAb has an S-score of at least 2.5. For example, if a MAb binds to protein X with a Z-score of 43 and to protein Y with a Z-score of 14, then the S-score for the binding of that MAb to protein X is equal to 29.)
Ep-CAM/CD326, Monoclonal Antibody (Cat# AAA23890)
Full Name
Ep-CAM/CD326 (Extracellular Domain) (Epithelial Marker)
Gene Names
EPCAM; ESA; KSA; M4S1; MK-1; DIAR5; EGP-2; EGP40; KS1/4; MIC18; TROP1; EGP314; HNPCC8; TACSTD1
Reactivity
Human. Others not known.
Applications
FC/FACS, IF, WB, IHC
Pricing


 Application Data
(Immunoperoxidase staining of rat lymph node cryosection with Mouse anti Rat CD25 followed by horseradish peroxidase conjugated Goat anti Mouse IgG1 as a detection reagent. High power)
Application Data
(Immunoperoxidase staining of rat lymph node cryosection with Mouse anti Rat CD25 followed by horseradish peroxidase conjugated Goat anti Mouse IgG1 as a detection reagent. High power)
CD25, Monoclonal Antibody (Cat# AAA11966)
Full Name
MOUSE ANTI RAT CD25
Gene Names
Il2ra; IL2RAC
Applications
EIA, FC/FACS, IP
Pricing


 SDS-PAGE
(SDS Page analysis of purified S100B Mouse Monoclonal Antibody (S100B/1012).)
SDS-PAGE
(SDS Page analysis of purified S100B Mouse Monoclonal Antibody (S100B/1012).)
S100B, Monoclonal Antibody (Cat# AAA23893)
Full Name
S100B (Astrocyte and Melanoma Marker)
Gene Names
S100B; NEF; S100; S100-B; S100beta
Reactivity
Human, Mouse, Rat, Cow. Others not known.
Applications
FC/FACS, IF, WB, IHC
Pricing


 Application Data
(Analysis of Protein Array containing more than 19, 000 full-length human proteins using Oct-2 Mouse Monoclonal Antibody (OCT2/2137) Z- and S- Score: The Z-score represents the strength of a signal that a monoclonal antibody (MAb) (in combination with a fluorescently-tagged anti-IgG secondary antibody) produces when binding to a particular protein on the HuProtTM array. Z-scores are described in units of standard deviations (SD's) above the mean value of all signals generated on that array. If targets on HuProtTM are arranged in descending order of the Z-score, the S-score is the difference (also in units of SD's) between the Z-score. S-score therefore represents the relative target specificity of a MAb to its intended target. A MAb is considered to specific to its intended target, if the MAb has an S-score of at least 2.5. For example, if a MAb binds to protein X with a Z-score of 43 and to protein Y with a Z-score of 14, then the S-score for the binding of that MAb to protein X is equal to 29.)
Application Data
(Analysis of Protein Array containing more than 19, 000 full-length human proteins using Oct-2 Mouse Monoclonal Antibody (OCT2/2137) Z- and S- Score: The Z-score represents the strength of a signal that a monoclonal antibody (MAb) (in combination with a fluorescently-tagged anti-IgG secondary antibody) produces when binding to a particular protein on the HuProtTM array. Z-scores are described in units of standard deviations (SD's) above the mean value of all signals generated on that array. If targets on HuProtTM are arranged in descending order of the Z-score, the S-score is the difference (also in units of SD's) between the Z-score. S-score therefore represents the relative target specificity of a MAb to its intended target. A MAb is considered to specific to its intended target, if the MAb has an S-score of at least 2.5. For example, if a MAb binds to protein X with a Z-score of 43 and to protein Y with a Z-score of 14, then the S-score for the binding of that MAb to protein X is equal to 29.)
OCT-2 (POU2F2), Monoclonal Antibody (Cat# AAA23902)
Full Name
OCT-2 (POU2F2) (B-Cell Marker)
Gene Names
POU2F2; OCT2; OTF2; Oct-2
Reactivity
Human. Others not known.
Applications
EIA, WB, IHC
Pricing


 Application Data
(Analysis of Protein Array containing more than 19,000 full-length human proteins using Cytokeratin 15 Mouse Monoclonal Antibody (KRT15/2957). Z- and S- Score: The Z-score represents the strength of a signal that a monoclonal antibody (MAb) (in combination with a fluorescently-tagged anti-IgG secondary antibody) produces when binding to a particular protein on the HuProtTM array. Z-scores are described in units of standard deviations (SD's) above the mean value of all signals generated on that array. If targets on HuProtTM are arranged in descending order of the Z-score, the S-score is the difference (also in units of SD's) between the Z-score. S-score therefore represents the relative target specificity of a MAb to its intended target. A MAb is considered to specific to its intended target, if the MAb has an S-score of at least 2.5. For example, if a MAb binds to protein X with a Z-score of 43 and to protein Y with a Z-score of 14, then the S-score for the binding of that MAb to protein X is equal to 29.)
Application Data
(Analysis of Protein Array containing more than 19,000 full-length human proteins using Cytokeratin 15 Mouse Monoclonal Antibody (KRT15/2957). Z- and S- Score: The Z-score represents the strength of a signal that a monoclonal antibody (MAb) (in combination with a fluorescently-tagged anti-IgG secondary antibody) produces when binding to a particular protein on the HuProtTM array. Z-scores are described in units of standard deviations (SD's) above the mean value of all signals generated on that array. If targets on HuProtTM are arranged in descending order of the Z-score, the S-score is the difference (also in units of SD's) between the Z-score. S-score therefore represents the relative target specificity of a MAb to its intended target. A MAb is considered to specific to its intended target, if the MAb has an S-score of at least 2.5. For example, if a MAb binds to protein X with a Z-score of 43 and to protein Y with a Z-score of 14, then the S-score for the binding of that MAb to protein X is equal to 29.)
Cytokeratin 15, Monoclonal Antibody (Cat# AAA23923)
Full Name
Cytokeratin 15 (Esophageal Squamous Cell Carcinoma Marker)
Gene Names
KRT15; K15; CK15; K1CO
Reactivity
Human
Applications
FC/FACS, IF, WB, IHC
Purity
Purified Ab with BSA and Azide at 200ug/ml OR Purified Ab WITHOUT BSA and Azide at 1.0mg/ml
Pricing


 Application Data
(Immunoperoxidase staining of rat lymph node cryosection with Mouse anti Rat CD25 followed by horseradish peroxidase conjugated Goat anti Mouse IgG1 as a detection reagent. High power)
Application Data
(Immunoperoxidase staining of rat lymph node cryosection with Mouse anti Rat CD25 followed by horseradish peroxidase conjugated Goat anti Mouse IgG1 as a detection reagent. High power)
CD25, Monoclonal Antibody (Cat# AAA11965)
Full Name
MOUSE ANTI RAT CD25
Gene Names
Il2ra; IL2RAC
Applications
EIA, FC/FACS, IP
Pricing


 Strength of Signal
(Analysis of Protein Array containing more than 19,000 full-length human proteins using Vimentin (VIM) Mouse Monoclonal Antibody (VM452)Z- and S- Score: The Z-score represents the strength of a signal that a monoclonal antibody (MAb) (in combination with a fluorescently-tagged anti-IgG secondary antibody) produces when binding to a particular protein on the HuProtTM array. Z-scores are described in units of standard deviations (SD's) above the mean value of all signals generated on that array. If targets on HuProtTM are arranged in descending order of the Z-score, the S-score is the difference (also in units of SD's) between the Z-score. S-score therefore represents the relative target specificity of a MAb to its intended target. A MAb is considered to specific to its intended target, if the MAb has an S-score of at least 2.5. For example, if a MAb binds to protein X with a Z-score of 43 and to protein Y with a Z-score of 14, then the S-score for the binding of that MAb to protein X is equal to 29.)
Strength of Signal
(Analysis of Protein Array containing more than 19,000 full-length human proteins using Vimentin (VIM) Mouse Monoclonal Antibody (VM452)Z- and S- Score: The Z-score represents the strength of a signal that a monoclonal antibody (MAb) (in combination with a fluorescently-tagged anti-IgG secondary antibody) produces when binding to a particular protein on the HuProtTM array. Z-scores are described in units of standard deviations (SD's) above the mean value of all signals generated on that array. If targets on HuProtTM are arranged in descending order of the Z-score, the S-score is the difference (also in units of SD's) between the Z-score. S-score therefore represents the relative target specificity of a MAb to its intended target. A MAb is considered to specific to its intended target, if the MAb has an S-score of at least 2.5. For example, if a MAb binds to protein X with a Z-score of 43 and to protein Y with a Z-score of 14, then the S-score for the binding of that MAb to protein X is equal to 29.)
Vimentin, Monoclonal Antibody (Cat# AAA13810)
Full Name
Vimentin (Mesenchymal Cell Marker) Mouse Monoclonal Antibody
Gene Names
VIM; HEL113; CTRCT30
Reactivity
Human, Cow, Dog, Cat, Pig, Goat, Chicken.
Does not react with Mouse and Rat
Does not react with Mouse and Rat
Applications
FC/FACS, IF, WB, IHC
Pricing


 Application Data
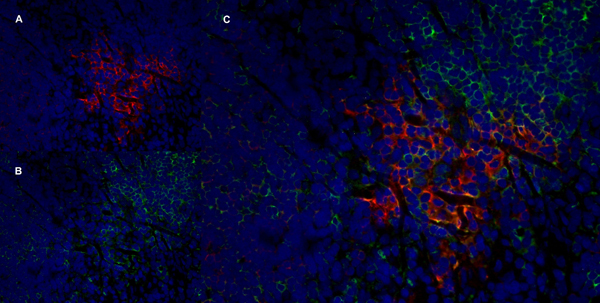
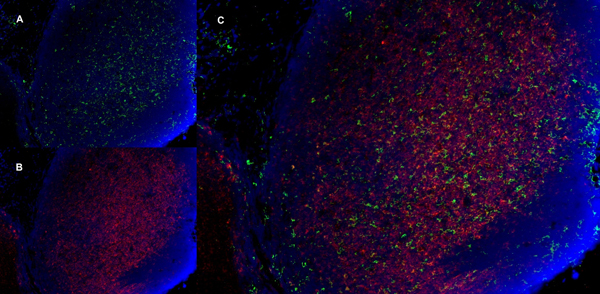
(Published customer image Infiltration of GFP+ BM-cells in infarct and peri-infarct regions. (A-B) Dot plots of viable macrophages/granulocytes (CD11b+CD45high, top right quadrants) and microglia (CD11b+CD45dim, bottom right quadrants) in cortex from BM-chimeric unmanipulated mice and mice exposed to pMCAO. (C) Bar graph showing mean numbers of CD11b+CD45dim microglia and CD11b+CD45high macrophages/granulocytes in BM-chimeric mice 24 hours after pMCAO, subdivided based on expression of GFP (n = 5). Approximately 92% of of the CD45high population were GFP+. (D) Estimation and comparison of mean numbers of CD11b+CD45dim microglia in non-chimeric (n = 10) versus BM-chimeric mice (n = 5) 24 hours after of pMCAO shows significantly fewer CD11b+CD45dim microglial cells in irradiated mice. (E) Overview, showing distribution of infiltrating GFP+ BM-derived cells into infarct (IF) and peri-infarct (P-IF) regions 24 hours after pMCAO. (E-G) By 24 hours, GFP+ single cells (F) and vessel-associated aggregates of GFP+ cells (arrows in G) were observed in infarct and peri-infarct regions. Some of the vessel-associated cells were round, leukocyte-like cells (arrows) while others were elongated cells lining the vasculature (arrow heads in G and in insert). (H) Bar graph showing mean numbers of single GFP+ cells and vessel-associated aggregates of GFP+ cells in ipsi- and contralateral cortex 24 hours after surgery (n = 10). (I-P) Immunohistochemical staining of CD45.1 (I, K), CD45.2 (J, L), IgG2a (M, O) and CD45 (N, P) in ischemic tissue in BM-chimeric (I, J, M, N) and non-chimeric mice (K, L, O, P) 24 hours after pMCAO. N.D, none detected. Scale bars: 200 um (A), 10 um (B, C). 50 um (I-P) *P < 0.05, **P < 0.01, and ***P < 0.001.From: Clausen BH, Lambertsen KL, Babcock AA, Holm TH, Dagnaes-Hansen F, Finsen B. Interleukin-1beta and tumor necrosis factor-alpha are expressed by different subsets of microglia and macrophages after ischemic stroke in mice. J Neuroinflammation. 2008 Oct 23;5:46.)
Application Data
(Published customer image Infiltration of GFP+ BM-cells in infarct and peri-infarct regions. (A-B) Dot plots of viable macrophages/granulocytes (CD11b+CD45high, top right quadrants) and microglia (CD11b+CD45dim, bottom right quadrants) in cortex from BM-chimeric unmanipulated mice and mice exposed to pMCAO. (C) Bar graph showing mean numbers of CD11b+CD45dim microglia and CD11b+CD45high macrophages/granulocytes in BM-chimeric mice 24 hours after pMCAO, subdivided based on expression of GFP (n = 5). Approximately 92% of of the CD45high population were GFP+. (D) Estimation and comparison of mean numbers of CD11b+CD45dim microglia in non-chimeric (n = 10) versus BM-chimeric mice (n = 5) 24 hours after of pMCAO shows significantly fewer CD11b+CD45dim microglial cells in irradiated mice. (E) Overview, showing distribution of infiltrating GFP+ BM-derived cells into infarct (IF) and peri-infarct (P-IF) regions 24 hours after pMCAO. (E-G) By 24 hours, GFP+ single cells (F) and vessel-associated aggregates of GFP+ cells (arrows in G) were observed in infarct and peri-infarct regions. Some of the vessel-associated cells were round, leukocyte-like cells (arrows) while others were elongated cells lining the vasculature (arrow heads in G and in insert). (H) Bar graph showing mean numbers of single GFP+ cells and vessel-associated aggregates of GFP+ cells in ipsi- and contralateral cortex 24 hours after surgery (n = 10). (I-P) Immunohistochemical staining of CD45.1 (I, K), CD45.2 (J, L), IgG2a (M, O) and CD45 (N, P) in ischemic tissue in BM-chimeric (I, J, M, N) and non-chimeric mice (K, L, O, P) 24 hours after pMCAO. N.D, none detected. Scale bars: 200 um (A), 10 um (B, C). 50 um (I-P) *P < 0.05, **P < 0.01, and ***P < 0.001.From: Clausen BH, Lambertsen KL, Babcock AA, Holm TH, Dagnaes-Hansen F, Finsen B. Interleukin-1beta and tumor necrosis factor-alpha are expressed by different subsets of microglia and macrophages after ischemic stroke in mice. J Neuroinflammation. 2008 Oct 23;5:46.)
CD11b, Monoclonal Antibody (Cat# AAA12184)
Full Name
RAT ANTI MOUSE CD11b
Gene Names
Itgam; CR3; CR3A; MAC1; Cd11b; Ly-40; Mac-1; Mac-1a; CD11b/CD18; F730045J24Rik
Applications
FC/FACS, IF, IP
Pricing


 Application Data
(Published customer image Infiltration of GFP+ BM-cells in infarct and peri-infarct regions. (A-B) Dot plots of viable macrophages/granulocytes (CD11b+CD45high, top right quadrants) and microglia (CD11b+CD45dim, bottom right quadrants) in cortex from BM-chimeric unmanipulated mice and mice exposed to pMCAO. (C) Bar graph showing mean numbers of CD11b+CD45dim microglia and CD11b+CD45high macrophages/granulocytes in BM-chimeric mice 24 hours after pMCAO, subdivided based on expression of GFP (n = 5). Approximately 92% of of the CD45high population were GFP+. (D) Estimation and comparison of mean numbers of CD11b+CD45dim microglia in non-chimeric (n = 10) versus BM-chimeric mice (n = 5) 24 hours after of pMCAO shows significantly fewer CD11b+CD45dim microglial cells in irradiated mice. (E) Overview, showing distribution of infiltrating GFP+ BM-derived cells into infarct (IF) and peri-infarct (P-IF) regions 24 hours after pMCAO. (E-G) By 24 hours, GFP+ single cells (F) and vessel-associated aggregates of GFP+ cells (arrows in G) were observed in infarct and peri-infarct regions. Some of the vessel-associated cells were round, leukocyte-like cells (arrows) while others were elongated cells lining the vasculature (arrow heads in G and in insert). (H) Bar graph showing mean numbers of single GFP+ cells and vessel-associated aggregates of GFP+ cells in ipsi- and contralateral cortex 24 hours after surgery (n = 10). (I-P) Immunohistochemical staining of CD45.1 (I, K), CD45.2 (J, L), IgG2a (M, O) and CD45 (N, P) in ischemic tissue in BM-chimeric (I, J, M, N) and non-chimeric mice (K, L, O, P) 24 hours after pMCAO. N.D, none detected. Scale bars: 200 um (A), 10 um (B, C). 50 um (I-P) *P < 0.05, **P < 0.01, and ***P < 0.001.From: Clausen BH, Lambertsen KL, Babcock AA, Holm TH, Dagnaes-Hansen F, Finsen B. Interleukin-1beta and tumor necrosis factor-alpha are expressed by different subsets of microglia and macrophages after ischemic stroke in mice. J Neuroinflammation. 2008 Oct 23;5:46.)
Application Data
(Published customer image Infiltration of GFP+ BM-cells in infarct and peri-infarct regions. (A-B) Dot plots of viable macrophages/granulocytes (CD11b+CD45high, top right quadrants) and microglia (CD11b+CD45dim, bottom right quadrants) in cortex from BM-chimeric unmanipulated mice and mice exposed to pMCAO. (C) Bar graph showing mean numbers of CD11b+CD45dim microglia and CD11b+CD45high macrophages/granulocytes in BM-chimeric mice 24 hours after pMCAO, subdivided based on expression of GFP (n = 5). Approximately 92% of of the CD45high population were GFP+. (D) Estimation and comparison of mean numbers of CD11b+CD45dim microglia in non-chimeric (n = 10) versus BM-chimeric mice (n = 5) 24 hours after of pMCAO shows significantly fewer CD11b+CD45dim microglial cells in irradiated mice. (E) Overview, showing distribution of infiltrating GFP+ BM-derived cells into infarct (IF) and peri-infarct (P-IF) regions 24 hours after pMCAO. (E-G) By 24 hours, GFP+ single cells (F) and vessel-associated aggregates of GFP+ cells (arrows in G) were observed in infarct and peri-infarct regions. Some of the vessel-associated cells were round, leukocyte-like cells (arrows) while others were elongated cells lining the vasculature (arrow heads in G and in insert). (H) Bar graph showing mean numbers of single GFP+ cells and vessel-associated aggregates of GFP+ cells in ipsi- and contralateral cortex 24 hours after surgery (n = 10). (I-P) Immunohistochemical staining of CD45.1 (I, K), CD45.2 (J, L), IgG2a (M, O) and CD45 (N, P) in ischemic tissue in BM-chimeric (I, J, M, N) and non-chimeric mice (K, L, O, P) 24 hours after pMCAO. N.D, none detected. Scale bars: 200 um (A), 10 um (B, C). 50 um (I-P) *P < 0.05, **P < 0.01, and ***P < 0.001.From: Clausen BH, Lambertsen KL, Babcock AA, Holm TH, Dagnaes-Hansen F, Finsen B. Interleukin-1beta and tumor necrosis factor-alpha are expressed by different subsets of microglia and macrophages after ischemic stroke in mice. J Neuroinflammation. 2008 Oct 23;5:46.)
CD11b, Monoclonal Antibody (Cat# AAA12185)
Full Name
RAT ANTI MOUSE CD11b
Gene Names
Itgam; CR3; CR3A; MAC1; Cd11b; Ly-40; Mac-1; Mac-1a; CD11b/CD18; F730045J24Rik
Applications
FC/FACS, IF, IP
Pricing


 Application Data
(Published customer image Infiltration of GFP+ BM-cells in infarct and peri-infarct regions. (A-B) Dot plots of viable macrophages/granulocytes (CD11b+CD45high, top right quadrants) and microglia (CD11b+CD45dim, bottom right quadrants) in cortex from BM-chimeric unmanipulated mice and mice exposed to pMCAO. (C) Bar graph showing mean numbers of CD11b+CD45dim microglia and CD11b+CD45high macrophages/granulocytes in BM-chimeric mice 24 hours after pMCAO, subdivided based on expression of GFP (n = 5). Approximately 92% of of the CD45high population were GFP+. (D) Estimation and comparison of mean numbers of CD11b+CD45dim microglia in non-chimeric (n = 10) versus BM-chimeric mice (n = 5) 24 hours after of pMCAO shows significantly fewer CD11b+CD45dim microglial cells in irradiated mice. (E) Overview, showing distribution of infiltrating GFP+ BM-derived cells into infarct (IF) and peri-infarct (P-IF) regions 24 hours after pMCAO. (E-G) By 24 hours, GFP+ single cells (F) and vessel-associated aggregates of GFP+ cells (arrows in G) were observed in infarct and peri-infarct regions. Some of the vessel-associated cells were round, leukocyte-like cells (arrows) while others were elongated cells lining the vasculature (arrow heads in G and in insert). (H) Bar graph showing mean numbers of single GFP+ cells and vessel-associated aggregates of GFP+ cells in ipsi- and contralateral cortex 24 hours after surgery (n = 10). (I-P) Immunohistochemical staining of CD45.1 (I, K), CD45.2 (J, L), IgG2a (M, O) and CD45 (N, P) in ischemic tissue in BM-chimeric (I, J, M, N) and non-chimeric mice (K, L, O, P) 24 hours after pMCAO. N.D, none detected. Scale bars: 200 um (A), 10 um (B, C). 50 um (I-P) *P < 0.05, **P < 0.01, and ***P < 0.001.From: Clausen BH, Lambertsen KL, Babcock AA, Holm TH, Dagnaes-Hansen F, Finsen B. Interleukin-1beta and tumor necrosis factor-alpha are expressed by different subsets of microglia and macrophages after ischemic stroke in mice. J Neuroinflammation. 2008 Oct 23;5:46.)
Application Data
(Published customer image Infiltration of GFP+ BM-cells in infarct and peri-infarct regions. (A-B) Dot plots of viable macrophages/granulocytes (CD11b+CD45high, top right quadrants) and microglia (CD11b+CD45dim, bottom right quadrants) in cortex from BM-chimeric unmanipulated mice and mice exposed to pMCAO. (C) Bar graph showing mean numbers of CD11b+CD45dim microglia and CD11b+CD45high macrophages/granulocytes in BM-chimeric mice 24 hours after pMCAO, subdivided based on expression of GFP (n = 5). Approximately 92% of of the CD45high population were GFP+. (D) Estimation and comparison of mean numbers of CD11b+CD45dim microglia in non-chimeric (n = 10) versus BM-chimeric mice (n = 5) 24 hours after of pMCAO shows significantly fewer CD11b+CD45dim microglial cells in irradiated mice. (E) Overview, showing distribution of infiltrating GFP+ BM-derived cells into infarct (IF) and peri-infarct (P-IF) regions 24 hours after pMCAO. (E-G) By 24 hours, GFP+ single cells (F) and vessel-associated aggregates of GFP+ cells (arrows in G) were observed in infarct and peri-infarct regions. Some of the vessel-associated cells were round, leukocyte-like cells (arrows) while others were elongated cells lining the vasculature (arrow heads in G and in insert). (H) Bar graph showing mean numbers of single GFP+ cells and vessel-associated aggregates of GFP+ cells in ipsi- and contralateral cortex 24 hours after surgery (n = 10). (I-P) Immunohistochemical staining of CD45.1 (I, K), CD45.2 (J, L), IgG2a (M, O) and CD45 (N, P) in ischemic tissue in BM-chimeric (I, J, M, N) and non-chimeric mice (K, L, O, P) 24 hours after pMCAO. N.D, none detected. Scale bars: 200 um (A), 10 um (B, C). 50 um (I-P) *P < 0.05, **P < 0.01, and ***P < 0.001.From: Clausen BH, Lambertsen KL, Babcock AA, Holm TH, Dagnaes-Hansen F, Finsen B. Interleukin-1beta and tumor necrosis factor-alpha are expressed by different subsets of microglia and macrophages after ischemic stroke in mice. J Neuroinflammation. 2008 Oct 23;5:46.)
CD11b, Monoclonal Antibody (Cat# AAA12181)
Full Name
RAT ANTI MOUSE CD11b
Gene Names
Itgam; CR3; CR3A; MAC1; Cd11b; Ly-40; Mac-1; Mac-1a; CD11b/CD18; F730045J24Rik
Reactivity
Human
Applications
FC/FACS, IF, IP
Pricing


 Application Data
(Published customer image Infiltration of GFP+ BM-cells in infarct and peri-infarct regions. (A-B) Dot plots of viable macrophages/granulocytes (CD11b+CD45high, top right quadrants) and microglia (CD11b+CD45dim, bottom right quadrants) in cortex from BM-chimeric unmanipulated mice and mice exposed to pMCAO. (C) Bar graph showing mean numbers of CD11b+CD45dim microglia and CD11b+CD45high macrophages/granulocytes in BM-chimeric mice 24 hours after pMCAO, subdivided based on expression of GFP (n = 5). Approximately 92% of of the CD45high population were GFP+. (D) Estimation and comparison of mean numbers of CD11b+CD45dim microglia in non-chimeric (n = 10) versus BM-chimeric mice (n = 5) 24 hours after of pMCAO shows significantly fewer CD11b+CD45dim microglial cells in irradiated mice. (E) Overview, showing distribution of infiltrating GFP+ BM-derived cells into infarct (IF) and peri-infarct (P-IF) regions 24 hours after pMCAO. (E-G) By 24 hours, GFP+ single cells (F) and vessel-associated aggregates of GFP+ cells (arrows in G) were observed in infarct and peri-infarct regions. Some of the vessel-associated cells were round, leukocyte-like cells (arrows) while others were elongated cells lining the vasculature (arrow heads in G and in insert). (H) Bar graph showing mean numbers of single GFP+ cells and vessel-associated aggregates of GFP+ cells in ipsi- and contralateral cortex 24 hours after surgery (n = 10). (I-P) Immunohistochemical staining of CD45.1 (I, K), CD45.2 (J, L), IgG2a (M, O) and CD45 (N, P) in ischemic tissue in BM-chimeric (I, J, M, N) and non-chimeric mice (K, L, O, P) 24 hours after pMCAO. N.D, none detected. Scale bars: 200 um (A), 10 um (B, C). 50 um (I-P) *P < 0.05, **P < 0.01, and ***P < 0.001.From: Clausen BH, Lambertsen KL, Babcock AA, Holm TH, Dagnaes-Hansen F, Finsen B. Interleukin-1beta and tumor necrosis factor-alpha are expressed by different subsets of microglia and macrophages after ischemic stroke in mice. J Neuroinflammation. 2008 Oct 23;5:46.)
Application Data
(Published customer image Infiltration of GFP+ BM-cells in infarct and peri-infarct regions. (A-B) Dot plots of viable macrophages/granulocytes (CD11b+CD45high, top right quadrants) and microglia (CD11b+CD45dim, bottom right quadrants) in cortex from BM-chimeric unmanipulated mice and mice exposed to pMCAO. (C) Bar graph showing mean numbers of CD11b+CD45dim microglia and CD11b+CD45high macrophages/granulocytes in BM-chimeric mice 24 hours after pMCAO, subdivided based on expression of GFP (n = 5). Approximately 92% of of the CD45high population were GFP+. (D) Estimation and comparison of mean numbers of CD11b+CD45dim microglia in non-chimeric (n = 10) versus BM-chimeric mice (n = 5) 24 hours after of pMCAO shows significantly fewer CD11b+CD45dim microglial cells in irradiated mice. (E) Overview, showing distribution of infiltrating GFP+ BM-derived cells into infarct (IF) and peri-infarct (P-IF) regions 24 hours after pMCAO. (E-G) By 24 hours, GFP+ single cells (F) and vessel-associated aggregates of GFP+ cells (arrows in G) were observed in infarct and peri-infarct regions. Some of the vessel-associated cells were round, leukocyte-like cells (arrows) while others were elongated cells lining the vasculature (arrow heads in G and in insert). (H) Bar graph showing mean numbers of single GFP+ cells and vessel-associated aggregates of GFP+ cells in ipsi- and contralateral cortex 24 hours after surgery (n = 10). (I-P) Immunohistochemical staining of CD45.1 (I, K), CD45.2 (J, L), IgG2a (M, O) and CD45 (N, P) in ischemic tissue in BM-chimeric (I, J, M, N) and non-chimeric mice (K, L, O, P) 24 hours after pMCAO. N.D, none detected. Scale bars: 200 um (A), 10 um (B, C). 50 um (I-P) *P < 0.05, **P < 0.01, and ***P < 0.001.From: Clausen BH, Lambertsen KL, Babcock AA, Holm TH, Dagnaes-Hansen F, Finsen B. Interleukin-1beta and tumor necrosis factor-alpha are expressed by different subsets of microglia and macrophages after ischemic stroke in mice. J Neuroinflammation. 2008 Oct 23;5:46.)
CD11b, Monoclonal Antibody (Cat# AAA12231)
Full Name
RAT ANTI MOUSE CD11b:Low Endotoxin
Gene Names
Itgam; CR3; CR3A; MAC1; Cd11b; Ly-40; Mac-1; Mac-1a; CD11b/CD18; F730045J24Rik
Applications
FC/FACS, FN, IF, IP
Pricing


 Application Data
(Published customer image Infiltration of GFP+ BM-cells in infarct and peri-infarct regions. (A-B) Dot plots of viable macrophages/granulocytes (CD11b+CD45high, top right quadrants) and microglia (CD11b+CD45dim, bottom right quadrants) in cortex from BM-chimeric unmanipulated mice and mice exposed to pMCAO. (C) Bar graph showing mean numbers of CD11b+CD45dim microglia and CD11b+CD45high macrophages/granulocytes in BM-chimeric mice 24 hours after pMCAO, subdivided based on expression of GFP (n = 5). Approximately 92% of of the CD45high population were GFP+. (D) Estimation and comparison of mean numbers of CD11b+CD45dim microglia in non-chimeric (n = 10) versus BM-chimeric mice (n = 5) 24 hours after of pMCAO shows significantly fewer CD11b+CD45dim microglial cells in irradiated mice. (E) Overview, showing distribution of infiltrating GFP+ BM-derived cells into infarct (IF) and peri-infarct (P-IF) regions 24 hours after pMCAO. (E-G) By 24 hours, GFP+ single cells (F) and vessel-associated aggregates of GFP+ cells (arrows in G) were observed in infarct and peri-infarct regions. Some of the vessel-associated cells were round, leukocyte-like cells (arrows) while others were elongated cells lining the vasculature (arrow heads in G and in insert). (H) Bar graph showing mean numbers of single GFP+ cells and vessel-associated aggregates of GFP+ cells in ipsi- and contralateral cortex 24 hours after surgery (n = 10). (I-P) Immunohistochemical staining of CD45.1 (I, K), CD45.2 (J, L), IgG2a (M, O) and CD45 (N, P) in ischemic tissue in BM-chimeric (I, J, M, N) and non-chimeric mice (K, L, O, P) 24 hours after pMCAO. N.D, none detected. Scale bars: 200 um (A), 10 um (B, C). 50 um (I-P) *P < 0.05, **P < 0.01, and ***P < 0.001.From: Clausen BH, Lambertsen KL, Babcock AA, Holm TH, Dagnaes-Hansen F, Finsen B. Interleukin-1beta and tumor necrosis factor-alpha are expressed by different subsets of microglia and macrophages after ischemic stroke in mice. J Neuroinflammation. 2008 Oct 23;5:46.)
Application Data
(Published customer image Infiltration of GFP+ BM-cells in infarct and peri-infarct regions. (A-B) Dot plots of viable macrophages/granulocytes (CD11b+CD45high, top right quadrants) and microglia (CD11b+CD45dim, bottom right quadrants) in cortex from BM-chimeric unmanipulated mice and mice exposed to pMCAO. (C) Bar graph showing mean numbers of CD11b+CD45dim microglia and CD11b+CD45high macrophages/granulocytes in BM-chimeric mice 24 hours after pMCAO, subdivided based on expression of GFP (n = 5). Approximately 92% of of the CD45high population were GFP+. (D) Estimation and comparison of mean numbers of CD11b+CD45dim microglia in non-chimeric (n = 10) versus BM-chimeric mice (n = 5) 24 hours after of pMCAO shows significantly fewer CD11b+CD45dim microglial cells in irradiated mice. (E) Overview, showing distribution of infiltrating GFP+ BM-derived cells into infarct (IF) and peri-infarct (P-IF) regions 24 hours after pMCAO. (E-G) By 24 hours, GFP+ single cells (F) and vessel-associated aggregates of GFP+ cells (arrows in G) were observed in infarct and peri-infarct regions. Some of the vessel-associated cells were round, leukocyte-like cells (arrows) while others were elongated cells lining the vasculature (arrow heads in G and in insert). (H) Bar graph showing mean numbers of single GFP+ cells and vessel-associated aggregates of GFP+ cells in ipsi- and contralateral cortex 24 hours after surgery (n = 10). (I-P) Immunohistochemical staining of CD45.1 (I, K), CD45.2 (J, L), IgG2a (M, O) and CD45 (N, P) in ischemic tissue in BM-chimeric (I, J, M, N) and non-chimeric mice (K, L, O, P) 24 hours after pMCAO. N.D, none detected. Scale bars: 200 um (A), 10 um (B, C). 50 um (I-P) *P < 0.05, **P < 0.01, and ***P < 0.001.From: Clausen BH, Lambertsen KL, Babcock AA, Holm TH, Dagnaes-Hansen F, Finsen B. Interleukin-1beta and tumor necrosis factor-alpha are expressed by different subsets of microglia and macrophages after ischemic stroke in mice. J Neuroinflammation. 2008 Oct 23;5:46.)
CD11b, Monoclonal Antibody (Cat# AAA12183)
Full Name
RAT ANTI MOUSE CD11b:FITC
Gene Names
Itgam; CR3; CR3A; MAC1; Cd11b; Ly-40; Mac-1; Mac-1a; CD11b/CD18; F730045J24Rik
Applications
FC/FACS
Pricing


 Application Data
(Published customer image Infiltration of GFP+ BM-cells in infarct and peri-infarct regions. (A-B) Dot plots of viable macrophages/granulocytes (CD11b+CD45high, top right quadrants) and microglia (CD11b+CD45dim, bottom right quadrants) in cortex from BM-chimeric unmanipulated mice and mice exposed to pMCAO. (C) Bar graph showing mean numbers of CD11b+CD45dim microglia and CD11b+CD45high macrophages/granulocytes in BM-chimeric mice 24 hours after pMCAO, subdivided based on expression of GFP (n = 5). Approximately 92% of of the CD45high population were GFP+. (D) Estimation and comparison of mean numbers of CD11b+CD45dim microglia in non-chimeric (n = 10) versus BM-chimeric mice (n = 5) 24 hours after of pMCAO shows significantly fewer CD11b+CD45dim microglial cells in irradiated mice. (E) Overview, showing distribution of infiltrating GFP+ BM-derived cells into infarct (IF) and peri-infarct (P-IF) regions 24 hours after pMCAO. (E-G) By 24 hours, GFP+ single cells (F) and vessel-associated aggregates of GFP+ cells (arrows in G) were observed in infarct and peri-infarct regions. Some of the vessel-associated cells were round, leukocyte-like cells (arrows) while others were elongated cells lining the vasculature (arrow heads in G and in insert). (H) Bar graph showing mean numbers of single GFP+ cells and vessel-associated aggregates of GFP+ cells in ipsi- and contralateral cortex 24 hours after surgery (n = 10). (I-P) Immunohistochemical staining of CD45.1 (I, K), CD45.2 (J, L), IgG2a (M, O) and CD45 (N, P) in ischemic tissue in BM-chimeric (I, J, M, N) and non-chimeric mice (K, L, O, P) 24 hours after pMCAO. N.D, none detected. Scale bars: 200 um (A), 10 um (B, C). 50 um (I-P) *P < 0.05, **P < 0.01, and ***P < 0.001.From: Clausen BH, Lambertsen KL, Babcock AA, Holm TH, Dagnaes-Hansen F, Finsen B. Interleukin-1beta and tumor necrosis factor-alpha are expressed by different subsets of microglia and macrophages after ischemic stroke in mice. J Neuroinflammation. 2008 Oct 23;5:46.)
Application Data
(Published customer image Infiltration of GFP+ BM-cells in infarct and peri-infarct regions. (A-B) Dot plots of viable macrophages/granulocytes (CD11b+CD45high, top right quadrants) and microglia (CD11b+CD45dim, bottom right quadrants) in cortex from BM-chimeric unmanipulated mice and mice exposed to pMCAO. (C) Bar graph showing mean numbers of CD11b+CD45dim microglia and CD11b+CD45high macrophages/granulocytes in BM-chimeric mice 24 hours after pMCAO, subdivided based on expression of GFP (n = 5). Approximately 92% of of the CD45high population were GFP+. (D) Estimation and comparison of mean numbers of CD11b+CD45dim microglia in non-chimeric (n = 10) versus BM-chimeric mice (n = 5) 24 hours after of pMCAO shows significantly fewer CD11b+CD45dim microglial cells in irradiated mice. (E) Overview, showing distribution of infiltrating GFP+ BM-derived cells into infarct (IF) and peri-infarct (P-IF) regions 24 hours after pMCAO. (E-G) By 24 hours, GFP+ single cells (F) and vessel-associated aggregates of GFP+ cells (arrows in G) were observed in infarct and peri-infarct regions. Some of the vessel-associated cells were round, leukocyte-like cells (arrows) while others were elongated cells lining the vasculature (arrow heads in G and in insert). (H) Bar graph showing mean numbers of single GFP+ cells and vessel-associated aggregates of GFP+ cells in ipsi- and contralateral cortex 24 hours after surgery (n = 10). (I-P) Immunohistochemical staining of CD45.1 (I, K), CD45.2 (J, L), IgG2a (M, O) and CD45 (N, P) in ischemic tissue in BM-chimeric (I, J, M, N) and non-chimeric mice (K, L, O, P) 24 hours after pMCAO. N.D, none detected. Scale bars: 200 um (A), 10 um (B, C). 50 um (I-P) *P < 0.05, **P < 0.01, and ***P < 0.001.From: Clausen BH, Lambertsen KL, Babcock AA, Holm TH, Dagnaes-Hansen F, Finsen B. Interleukin-1beta and tumor necrosis factor-alpha are expressed by different subsets of microglia and macrophages after ischemic stroke in mice. J Neuroinflammation. 2008 Oct 23;5:46.)
CD11b, Monoclonal Antibody (Cat# AAA12182)
Full Name
RAT ANTI MOUSE CD11b:FITC
Gene Names
Itgam; CR3; CR3A; MAC1; Cd11b; Ly-40; Mac-1; Mac-1a; CD11b/CD18; F730045J24Rik
Applications
FC/FACS
Pricing


 Application Data
(Published customer image Infiltration of GFP+ BM-cells in infarct and peri-infarct regions. (A-B) Dot plots of viable macrophages/granulocytes (CD11b+CD45high, top right quadrants) and microglia (CD11b+CD45dim, bottom right quadrants) in cortex from BM-chimeric unmanipulated mice and mice exposed to pMCAO. (C) Bar graph showing mean numbers of CD11b+CD45dim microglia and CD11b+CD45high macrophages/granulocytes in BM-chimeric mice 24 hours after pMCAO, subdivided based on expression of GFP (n = 5). Approximately 92% of of the CD45high population were GFP+. (D) Estimation and comparison of mean numbers of CD11b+CD45dim microglia in non-chimeric (n = 10) versus BM-chimeric mice (n = 5) 24 hours after of pMCAO shows significantly fewer CD11b+CD45dim microglial cells in irradiated mice. (E) Overview, showing distribution of infiltrating GFP+ BM-derived cells into infarct (IF) and peri-infarct (P-IF) regions 24 hours after pMCAO. (E-G) By 24 hours, GFP+ single cells (F) and vessel-associated aggregates of GFP+ cells (arrows in G) were observed in infarct and peri-infarct regions. Some of the vessel-associated cells were round, leukocyte-like cells (arrows) while others were elongated cells lining the vasculature (arrow heads in G and in insert). (H) Bar graph showing mean numbers of single GFP+ cells and vessel-associated aggregates of GFP+ cells in ipsi- and contralateral cortex 24 hours after surgery (n = 10). (I-P) Immunohistochemical staining of CD45.1 (I, K), CD45.2 (J, L), IgG2a (M, O) and CD45 (N, P) in ischemic tissue in BM-chimeric (I, J, M, N) and non-chimeric mice (K, L, O, P) 24 hours after pMCAO. N.D, none detected. Scale bars: 200 um (A), 10 um (B, C). 50 um (I-P) *P < 0.05, **P < 0.01, and ***P < 0.001.From: Clausen BH, Lambertsen KL, Babcock AA, Holm TH, Dagnaes-Hansen F, Finsen B. Interleukin-1beta and tumor necrosis factor-alpha are expressed by different subsets of microglia and macrophages after ischemic stroke in mice. J Neuroinflammation. 2008 Oct 23;5:46.)
Application Data
(Published customer image Infiltration of GFP+ BM-cells in infarct and peri-infarct regions. (A-B) Dot plots of viable macrophages/granulocytes (CD11b+CD45high, top right quadrants) and microglia (CD11b+CD45dim, bottom right quadrants) in cortex from BM-chimeric unmanipulated mice and mice exposed to pMCAO. (C) Bar graph showing mean numbers of CD11b+CD45dim microglia and CD11b+CD45high macrophages/granulocytes in BM-chimeric mice 24 hours after pMCAO, subdivided based on expression of GFP (n = 5). Approximately 92% of of the CD45high population were GFP+. (D) Estimation and comparison of mean numbers of CD11b+CD45dim microglia in non-chimeric (n = 10) versus BM-chimeric mice (n = 5) 24 hours after of pMCAO shows significantly fewer CD11b+CD45dim microglial cells in irradiated mice. (E) Overview, showing distribution of infiltrating GFP+ BM-derived cells into infarct (IF) and peri-infarct (P-IF) regions 24 hours after pMCAO. (E-G) By 24 hours, GFP+ single cells (F) and vessel-associated aggregates of GFP+ cells (arrows in G) were observed in infarct and peri-infarct regions. Some of the vessel-associated cells were round, leukocyte-like cells (arrows) while others were elongated cells lining the vasculature (arrow heads in G and in insert). (H) Bar graph showing mean numbers of single GFP+ cells and vessel-associated aggregates of GFP+ cells in ipsi- and contralateral cortex 24 hours after surgery (n = 10). (I-P) Immunohistochemical staining of CD45.1 (I, K), CD45.2 (J, L), IgG2a (M, O) and CD45 (N, P) in ischemic tissue in BM-chimeric (I, J, M, N) and non-chimeric mice (K, L, O, P) 24 hours after pMCAO. N.D, none detected. Scale bars: 200 um (A), 10 um (B, C). 50 um (I-P) *P < 0.05, **P < 0.01, and ***P < 0.001.From: Clausen BH, Lambertsen KL, Babcock AA, Holm TH, Dagnaes-Hansen F, Finsen B. Interleukin-1beta and tumor necrosis factor-alpha are expressed by different subsets of microglia and macrophages after ischemic stroke in mice. J Neuroinflammation. 2008 Oct 23;5:46.)
CD11b, Monoclonal Antibody (Cat# AAA12186)
Full Name
RAT ANTI MOUSE CD11b:RPE
Gene Names
Itgam; CR3; CR3A; MAC1; Cd11b; Ly-40; Mac-1; Mac-1a; CD11b/CD18; F730045J24Rik
Applications
FC/FACS
Pricing