 Application Data
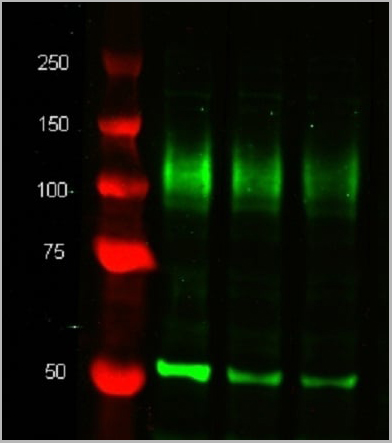
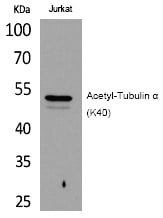
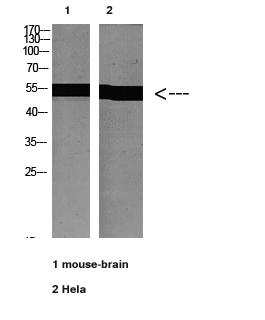
(Western blot analysis of CD107b on J774 cell lysate probed with Rat anti Mouse CD107b at 1/500, 1/1000, 1/2000. Rat anti tubulin alpha is included as a loading control. Detection is with Goat anti Rat IgG:Dylight®)
Application Data
(Western blot analysis of CD107b on J774 cell lysate probed with Rat anti Mouse CD107b at 1/500, 1/1000, 1/2000. Rat anti tubulin alpha is included as a loading control. Detection is with Goat anti Rat IgG:Dylight®)
Rat TUBULIN ALPHA Monoclonal Antibody
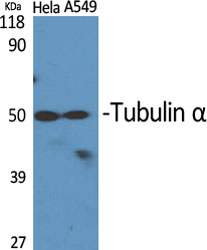
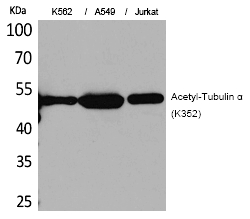
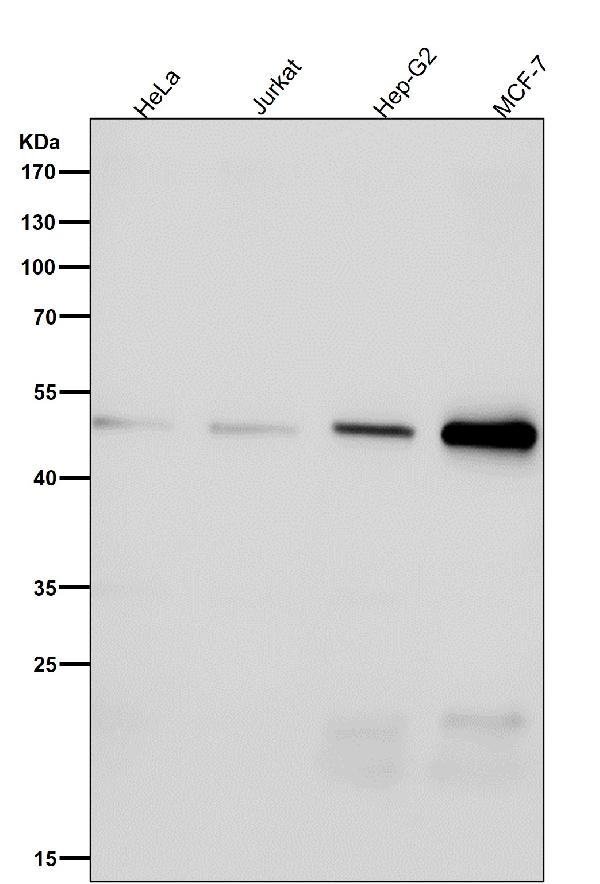
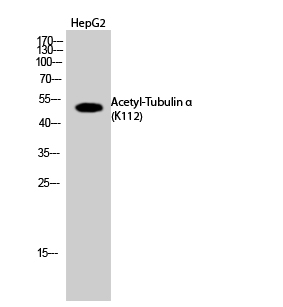
RAT ANTI TUBULIN ALPHA
Where this product has not been tested for use in a particular technique this does not necessarily exclude its use in such procedures. Suggested working dilutions are given as a guide only. It is recommended that the user titrates the product for use in their own system using appropriate negative/positive controls.
Application Data
(Western blot analysis of CD107b on J774 cell lysate probed with Rat anti Mouse CD107b at 1/500, 1/1000, 1/2000. Rat anti tubulin alpha is included as a loading control. Detection is with Goat anti Rat IgG:Dylight®)
Application Data
(Western blot analysis of CD107b on J774 cell lysate probed with Rat anti Mouse CD107b at 1/500, 1/1000, 1/2000. Rat anti tubulin alpha is included as a loading control. Detection is with Goat anti Rat IgG:Dylight®)
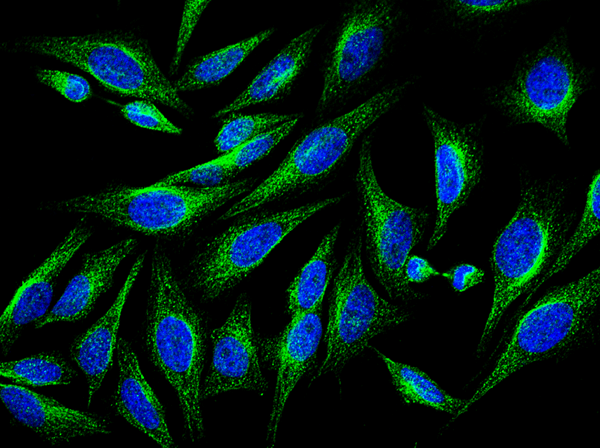
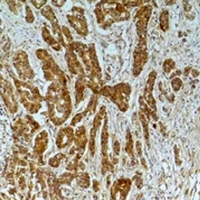
Application Data
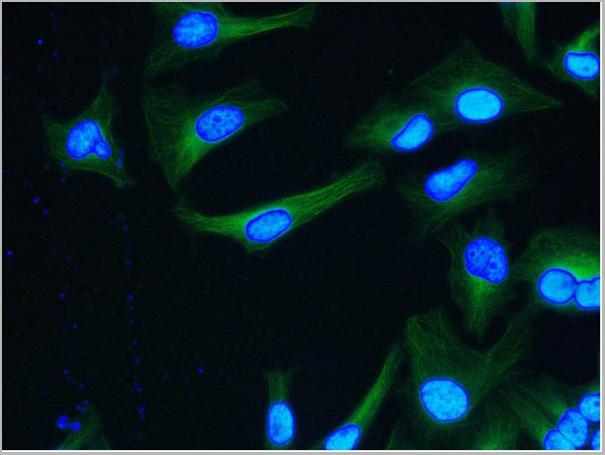
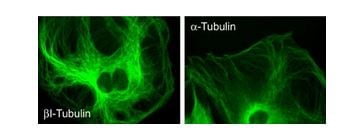
(HeLa cells stained with Rat anti tubulin apha green, nuclei are counterstained with DAPI)
Application Data
(HeLa cells stained with Rat anti tubulin apha green, nuclei are counterstained with DAPI)
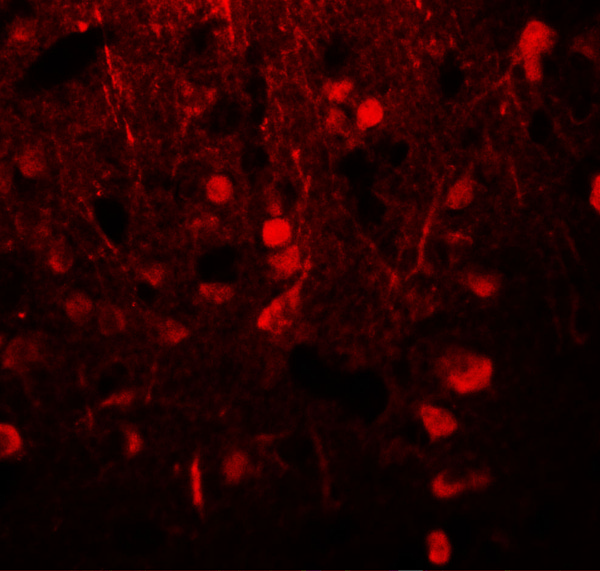
Application Data
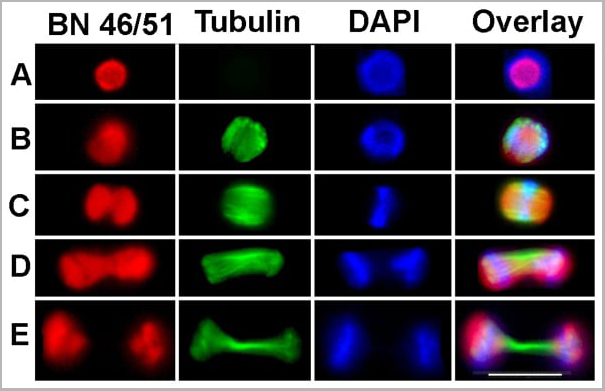
(Published customer image:Stages of Mitosis in Naegleria Revealed by Staining for a-Tubulin, BN46/51 and DAPI. Images were obtained by conventional epifluorescence microscopy. A. Interphase; B. Prophase; C. Metaphase; D. Anaphase; E. Telophase. Bar = 10 um. Red, BN46/51; Green, a-tubulin; Blue, DAPI.Walsh CJ (2012) The Structure of the Mitotic Spindle and Nucleolus during Mitosis in the Amebo-Flagellate Naegleria. PLoS ONE 7(4): e34763.)
Application Data
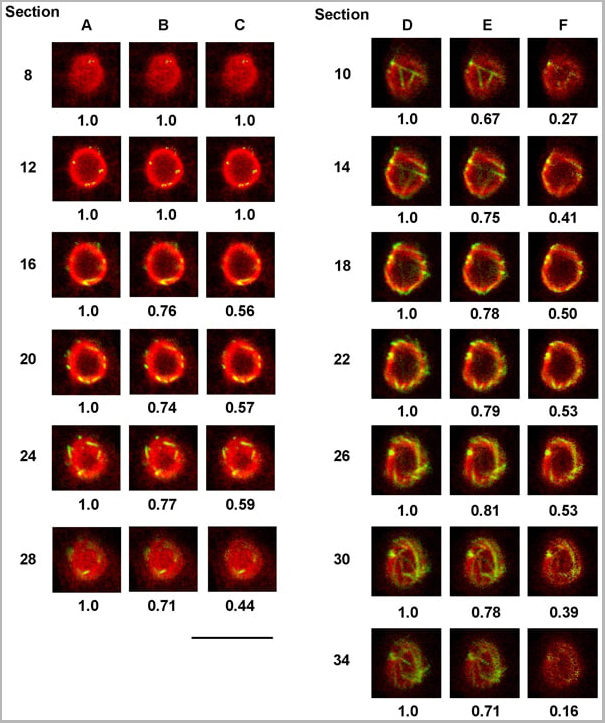
(Published customer image:Analysis of the Co-localization of Tubulin and the Nucleolar Protein BN46/51 During Prophase. Single 0.25 um optical sections at 1.0 um intervals are presented for two different cells. Columns A and D; raw data. Columns B and E; tubulin pixels are only displayed if the corresponding nucleolar protein pixel equaled or exceeded 25% of the maximum possible intensity. Columns C and F; tubulin pixels are only displayed if the corresponding nucleolar protein pixel equaled or exceeded 50% of maximum possible intensity. Numerical values are the summed fraction of tubulin intensity remaining in a given section after the subtraction. Red, BN 46/51; Green, a-tubulin. Bar = 10 um.From: Walsh CJ (2012) The Structure of the Mitotic Spindle and Nucleolus during Mitosis in the Amebo-Flagellate Naegleria. PLoS ONE 7(4): e34763.)
Application Data
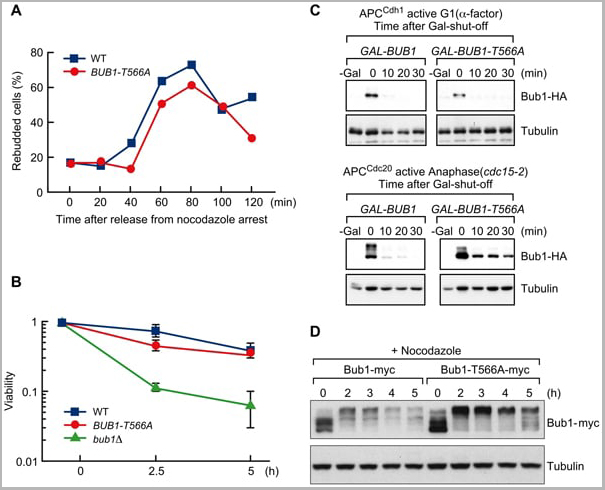
(Published customer image:T566 phosphorylation affects Bub1 stability. (A) BUB1-T566A mutant cells do not show substantial delay in recovering from nocodazole arrest. Wild-type (WT) and BUB1-T566A mutant cells were incubated with nocodazole (15 ug/mL) at 30 degree C for 90 min and then released from nocodazole arrest; at the indicated times, samples were taken to measure rebudded cells. (B) BUB1-T566A mutant cells show no significant sensitivity to nocodazole in a survival assay. Wild-type (WT), bub1?, and BUB1-T566A cells were incubated with nocodazole (15 ug/mL); at the indicated times, cells were washed out and approximately 200 cells were plated on a YPD plate. Cell viability was calculated by dividing the number of colonies formed at the 2.5 and 5 h time points by that formed in the absence of nocodazole (0 h) at 30 degree C. (C) Phosphorylation of T566 is important for degradation of Bub1 during anaphase but not during G1. cdc15-2 cells with HA-tagged Bub1 or Bub1-T566A expressed by the GAL1 promoter (GAL-BUB1 and GAL-BUB1-T566A) were arrested in anaphase (cdc15-2) or in G1 (alpha-factor) and then transferred to medium containing galactose for 2 h to induce Bub1 expression. Glucose was added to shut-off Bub1 expression; samples were taken at the indicated times for Western blot analyses with antibody to the HA epitope. Tubulin was used as a loading control. (D) The Bub1-T566A protein is more stable than wild-type in the presence of nocodazole. Wild-type and BUB1-T566A mutant cells (Bub1 and Bub1-T566A are tagged with myc) were incubated in the presence of nocodazole (10 ug/mL) at 30 degree C; at the indicated times, samples were taken for Western blot analyses with antibody to the myc epitope. Tubulin was used as a loading control.From: Goto GH, Mishra A, Abdulle R, Slaughter CA, Kitagawa K (2011) Bub1-Mediated Adaptation of the Spindle Checkpoint. PLoS Genet 7(1): e1001282.)
Application Data
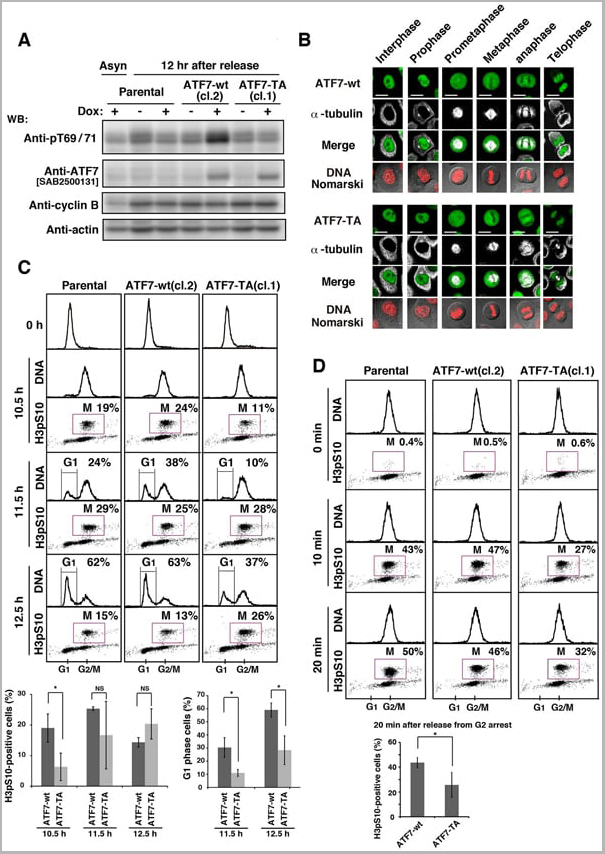
(Published customer image: Role of the phosphorylation of ATF7 in G2/M progression. (A) Parental HeLa S3/TR, HeLa S3/TR/ATF7-wt (cl.2), or HeLa S3/TR/ATF7-TA (cl.1) cells were synchronized using DTB and released into thymidine-free medium containing 1 ug/ml Dox for 12?h. Whole cell lysates were analyzed by WB. Full-length blots are presented in S12A Fig. (B) HeLa S3/TR/ATF7-wt (cl.2) (upper panels) or HeLa S3/TR/ATF7-TA (cl.1) cells (lower panels) were synchronized using single-thymidine block and released into thymidine-free medium containing 1 ug/ml Dox for 11 h. Cells were triply stained with anti-ATF7[SAB2500131] and anti-a-tubulin antibodies and PI (for DNA). Scale bars, 20 um. (C, D) Cells were stained with anti-histone H3pS10 antibody (for M phase) and PI for analyzing cell-cycle progression by flow cytometry. (C) Parental HeLa S3/TR, HeLa S3/TR/ATF7-wt (cl.2), or HeLa S3/TR/ATF7-TA (cl.1) cells were synchronized using DTB and released into thymidine-free medium containing 1 ug/ml Dox for 10.5~12.5 h. Two-dimensional histograms (DNA vs histone H3pS10) are presented together with DNA histograms, and the percentages of cells in G1 and M phases were measured. Cells in M and and G1 phases were quantitated from the results of S4 Fig. Values are means +/- SD (three independent clones). Asterisks indicate the significant difference (*P)
Application Data
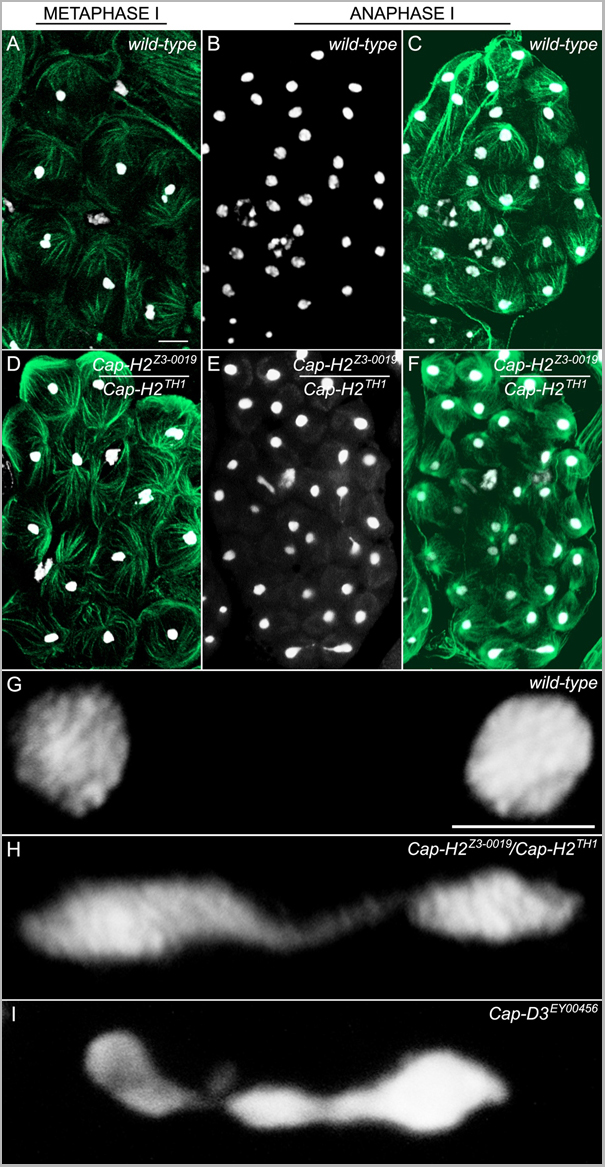
(Published customer image:Chromosomes remain associated into anaphase I of Cap-H2 mutants. Metaphase I and anaphase I morphologies were compared between wild-type and Cap-H2Z3-0019/Cap-H2TH1 mutant males. Testes were stained with DAPI and an anti-tubulin antibody to visualize DNA (white) and microtubules (green), respectively (scale bar in 3A indicates 10 um and 5 um in 3G). (A) Metaphase I in the wild-type. Each bivalent has congressed to the metaphase plate and appears as a cluster of DAPI stained material. (B) Anaphase I in the wild-type (DAPI only). Homologous chromosomes have segregated to daughter cells. (C) Anaphase I in the wild-type (DAPI and Tubulin merge). (D) Metaphase I from a Cap-H2Z3-0019/Cap-H2TH1 mutant male appears wild-type. (E) Anaphase I from a Cap-H2Z3-0019/Cap-H2TH1 mutant male (DAPI only). Chromatin bridges can be seen in three different segregation events. (F) Anaphase I from a Cap-H2Z3-0019/Cap-H2TH1 mutant male (DAPI and Tubulin merge). (G) Higher resolution wild-type anaphase I image showing complete segregation of homologs. (H) Anaphase I from a Cap-H2Z3-0019/Cap-H2TH1 mutant demonstrating extensive chromatin bridging due to persistent associations between chromosomes migrating to opposing poles. (I) Anaphase I bridge found from a Cap-D3EY00456 mutant.From: Hartl TA, Sweeney SJ, Knepler PJ, Bosco G (2008) Condensin II Resolves Chromosomal Associations to Enable Anaphase I Segregation in Drosophila Male Meiosis. PLoS Genet 4(10): e1000228.)
Application Data
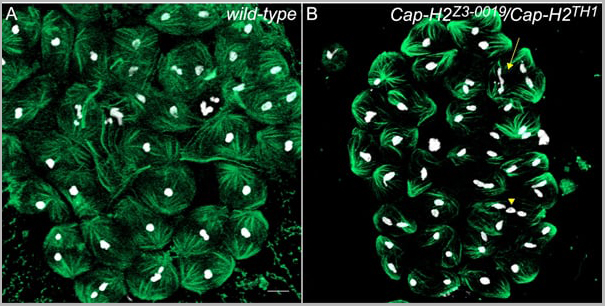
(Published customer image:Cap-H2 mutants are defective in anaphase II segregation. Metaphase II and anaphase II morphologies were compared between wild-type and Cap-H2Z3-0019/Cap-H2TH1 mutant males. Testes were stained with DAPI and an anti-tubulin antibody to visualize DNA (white) and microtubules (green), respectively (scale bar in 6A indicates 10 um). (A) Wild-type metaphase/anaphase II cyst. Metaphase II cells are those where each bivalent has congressed to the metaphase plate and appear as a cluster of DAPI staining material. Anaphase II are those cells with two DAPI staining white clusters, indicating homologous chromosome segregation. (B) Metaphase II and anaphase II figures from a Cap-H2 strong mutant. Arrow indicates an anaphase II bridge. The arrowhead highlights an anaphase II bridge or lagging chromosome.From: Hartl TA, Sweeney SJ, Knepler PJ, Bosco G (2008) Condensin II Resolves Chromosomal Associations to Enable Anaphase I Segregation in Drosophila Male Meiosis. PLoS Genet 4(10): e1000228.)
Application Data
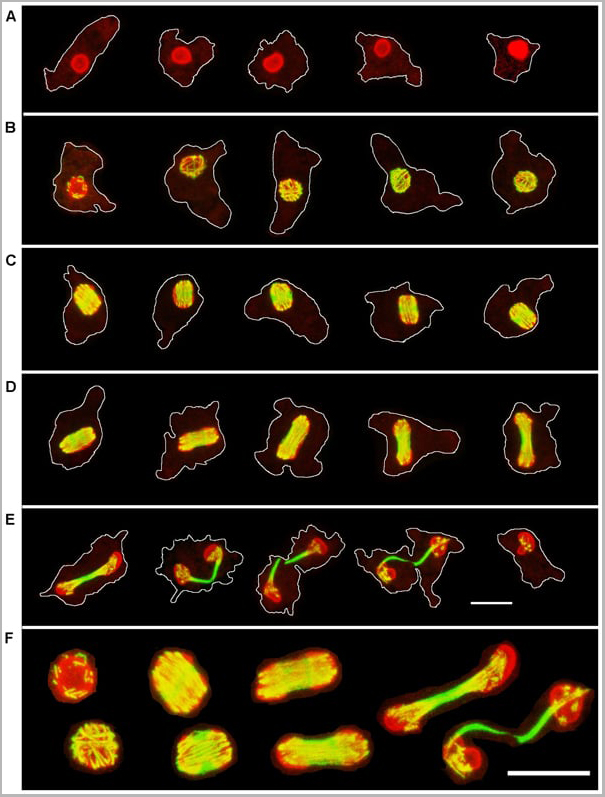
(Published customer image:Confocal Microscopy of Mitotic Cells Stained for a-Tubulin and the Nucleolar Protein BN46/51. Five examples of progressively later stages of each mitotic stage are presented. Each image is a Z-axis projection of 0.25 um optical sections through an individual cell. The cell periphery is outlined in white. A. Interphase; B. Prophase; C. Metaphase; D. Anaphase; E. Telophase. F. Selected nuclei of, from left to right, Prophase, Metaphase, Anaphase, and Telophase. Bar = 10 um. Red, BN 46/51; Green, a-tubulin.From: Walsh CJ (2012) The Structure of the Mitotic Spindle and Nucleolus during Mitosis in the Amebo-Flagellate Naegleria. PLoS ONE 7(4): e34763.)
Application Data
(Published customer image:Confocal Microscopy of Mitotic Cells Stained for a-Tubulin and the Nucleolar Protein BN46/51. Five examples of progressively later stages of each mitotic stage are presented. Each image is a Z-axis projection of 0.25 um optical sections through an individual cell. The cell periphery is outlined in white. A. Interphase; B. Prophase; C. Metaphase; D. Anaphase; E. Telophase. F. Selected nuclei of, from left to right, Prophase, Metaphase, Anaphase, and Telophase. Bar = 10 um. Red, BN 46/51; Green, a-tubulin.From: Walsh CJ (2012) The Structure of the Mitotic Spindle and Nucleolus during Mitosis in the Amebo-Flagellate Naegleria. PLoS ONE 7(4): e34763.)
Customer Reviews
Loading reviews...
Share Your Experience
Similar Products


Product Notes
The TUBULIN ALPHA (Catalog #AAA12010) is an Antibody produced from Rat and is intended for research purposes only. The product is available for immediate purchase. AAA Biotech's TUBULIN ALPHA can be used in a range of immunoassay formats including, but not limited to, IHC (Immunohistochemistry), ELISA, IF (Immunofluorescence), RIA (Radioimmunoassay), WB (Western Blot). ELISA: Maximum Dilution: 10ug/ml as detecting antibody Where this product has not been tested for use in a particular technique this does not necessarily exclude its use in such procedures. Suggested working dilutions are given as a guide only. It is recommended that the user titrates the product for use in their own system using appropriate negative/positive controls. Researchers should empirically determine the suitability of the TUBULIN ALPHA for an application not listed in the data sheet. Researchers commonly develop new applications and it is an integral, important part of the investigative research process. It is sometimes possible for the material contained within the vial of "TUBULIN ALPHA, Monoclonal Antibody" to become dispersed throughout the inside of the vial, particularly around the seal of said vial, during shipment and storage. We always suggest centrifuging these vials to consolidate all of the liquid away from the lid and to the bottom of the vial prior to opening. Please be advised that certain products may require dry ice for shipping and that, if this is the case, an additional dry ice fee may also be required.Precautions
All products in the AAA Biotech catalog are strictly for research-use only, and are absolutely not suitable for use in any sort of medical, therapeutic, prophylactic, in-vivo, or diagnostic capacity. By purchasing a product from AAA Biotech, you are explicitly certifying that said products will be properly tested and used in line with industry standard. AAA Biotech and its authorized distribution partners reserve the right to refuse to fulfill any order if we have any indication that a purchaser may be intending to use a product outside of our accepted criteria.Disclaimer
Though we do strive to guarantee the information represented in this datasheet, AAA Biotech cannot be held responsible for any oversights or imprecisions. AAA Biotech reserves the right to adjust any aspect of this datasheet at any time and without notice. It is the responsibility of the customer to inform AAA Biotech of any product performance issues observed or experienced within 30 days of receipt of said product. To see additional details on this or any of our other policies, please see our Terms & Conditions page.Item has been added to Shopping Cart
If you are ready to order, navigate to Shopping Cart and get ready to checkout.