Filters
▼Clonality
▼Type
▼Reactivity
▼Gene Name
▼Isotype
▼Host
▼Application
▼Clone
▼Monoclonal Antibodies
Get accurate results in your research with our Monoclonal Antibodies, which are specially made to target exactly what you require for your research, and will produce consistent, reliable performance in lab tests.
Viewing 4550-4600 of 27645 product results
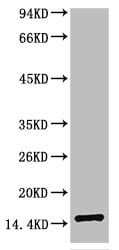
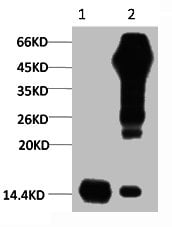
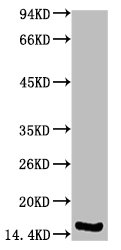 WB (Western Blot)
(Western blot analysis of Human Serum using TTR Mouse mAb diluted at 1:2000)
WB (Western Blot)
(Western blot analysis of Human Serum using TTR Mouse mAb diluted at 1:2000)
TTR, Monoclonal Antibody (Cat# AAA243661)
 WB (Western Blot)
(Western blot analysis of Human Serum using TTR Mouse mAb diluted at 1:2000.)
WB (Western Blot)
(Western blot analysis of Human Serum using TTR Mouse mAb diluted at 1:2000.)
TTR, Monoclonal Antibody (Cat# AAA243664)
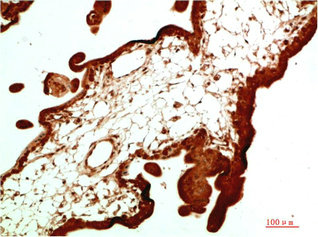
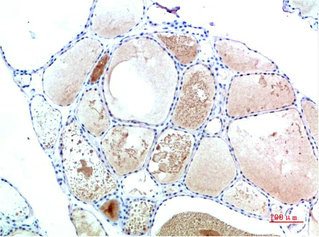
 IHC (Immunohiostchemistry)
(Immunohistochemical analysis of paraffin-embedded Human Placenta Tissue using HP-1alpha Mouse mAb diluted at 1:500)
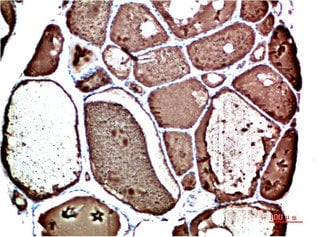
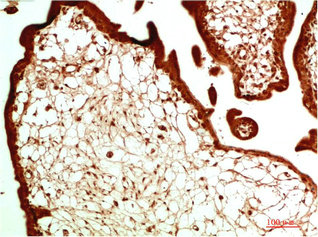
IHC (Immunohiostchemistry)
(Immunohistochemical analysis of paraffin-embedded Human Placenta Tissue using HP-1alpha Mouse mAb diluted at 1:500)
CBX5, Monoclonal Antibody (Cat# AAA243695)
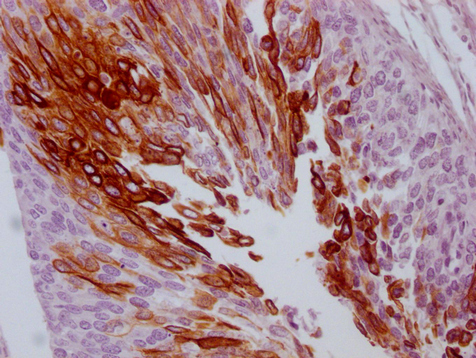
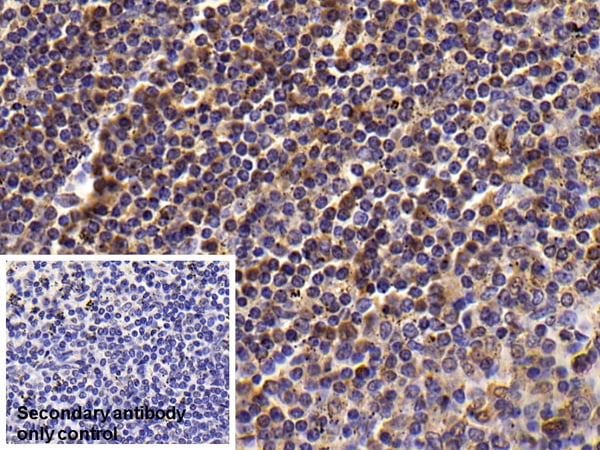
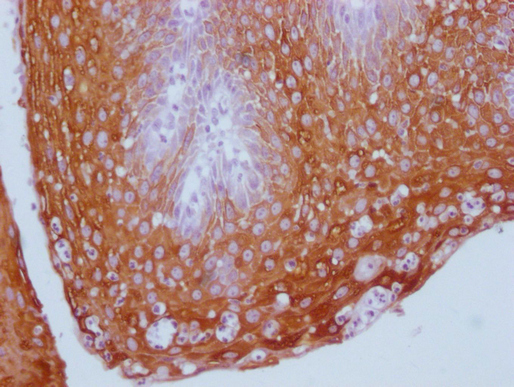 IHC (Immunohiostchemistry)
(IHC image of AAA243704 diluted at 1:100 and staining in paraffin-embedded human tonsil tissue performed on a Leica BondTM system. After dewaxing and hydration, antigen retrieval was mediated by high pressure in a citrate buffer (pH 6.0). Section was blocked with 10% normal goat serum 30min at RT. Then primary antibody (1% BSA) was incubated at 4 degree C overnight. The primary is detected by a Goat anti-mouse IgG polymer labeled by HRP and visualized using 0.05% DAB.)
IHC (Immunohiostchemistry)
(IHC image of AAA243704 diluted at 1:100 and staining in paraffin-embedded human tonsil tissue performed on a Leica BondTM system. After dewaxing and hydration, antigen retrieval was mediated by high pressure in a citrate buffer (pH 6.0). Section was blocked with 10% normal goat serum 30min at RT. Then primary antibody (1% BSA) was incubated at 4 degree C overnight. The primary is detected by a Goat anti-mouse IgG polymer labeled by HRP and visualized using 0.05% DAB.)
KRT13, Monoclonal Antibody (Cat# AAA243704)
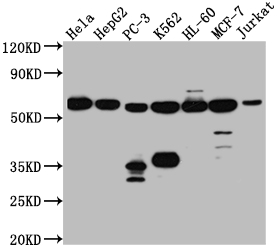
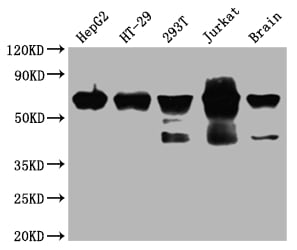
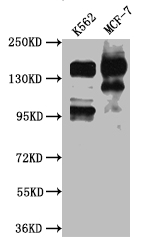
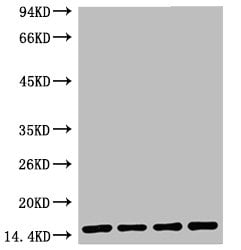 WB (Western Blot)
(Western blot analysis of 1) Hela, 2) Raw, 3) Mouse Brain Tissue, 4) Rat Brain Tissue, diluted at 1:5000.)
WB (Western Blot)
(Western blot analysis of 1) Hela, 2) Raw, 3) Mouse Brain Tissue, 4) Rat Brain Tissue, diluted at 1:5000.)
Histone H3, Monoclonal Antibody (Cat# AAA243722)
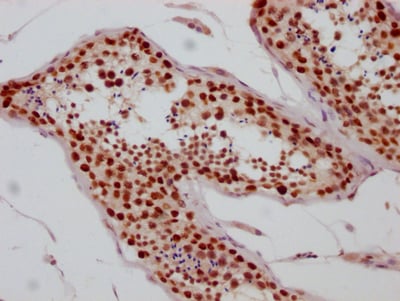
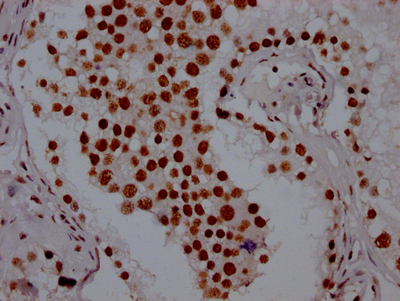
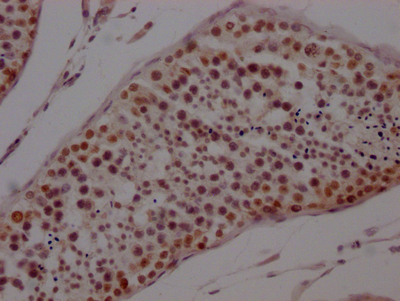 IHC (Immunohistochemisry)
(IHC image diluted at 1:100 and staining in paraffin-embedded human testis tissue performed on a Leica BondTM system. After dewaxing and hydration, antigen retrieval was mediated by high pressure in a citrate buffer (pH 6.0). Section was blocked with 10% normal goat serum 30min at RT. Then primary antibody (1% BSA) was incubated at 4 degree C overnight. The primary is detected by a Goat anti-rabbit IgG polymer labeled by HRP and visualized using 0.05% DAB.)
IHC (Immunohistochemisry)
(IHC image diluted at 1:100 and staining in paraffin-embedded human testis tissue performed on a Leica BondTM system. After dewaxing and hydration, antigen retrieval was mediated by high pressure in a citrate buffer (pH 6.0). Section was blocked with 10% normal goat serum 30min at RT. Then primary antibody (1% BSA) was incubated at 4 degree C overnight. The primary is detected by a Goat anti-rabbit IgG polymer labeled by HRP and visualized using 0.05% DAB.)
PTBP1, Monoclonal Recombinant Antibody (Cat# AAA244013)
 FCM/FACS (Flow Cytometry)
(Overlay histogram showing Hela cells stained with (red line) at 1?50. The cells were fixed with 70% Ethylalcohol (18h) and then incubated in 10% normal goat serum to block non-specific protein-protein interactions followedby the antibody (1ug/1*106cells) for 1 h at 4?.The secondary antibody used was FITC-conjugated goat anti-rabbit IgG (H+L) at 1/200 dilution for 30min at 4?. Control antibody (green line) was Rabbit IgG (1ug/1*106cells) used under the same conditions. Acquisition of >10,000 events was performed.)
FCM/FACS (Flow Cytometry)
(Overlay histogram showing Hela cells stained with (red line) at 1?50. The cells were fixed with 70% Ethylalcohol (18h) and then incubated in 10% normal goat serum to block non-specific protein-protein interactions followedby the antibody (1ug/1*106cells) for 1 h at 4?.The secondary antibody used was FITC-conjugated goat anti-rabbit IgG (H+L) at 1/200 dilution for 30min at 4?. Control antibody (green line) was Rabbit IgG (1ug/1*106cells) used under the same conditions. Acquisition of >10,000 events was performed.)
DDX5, Monoclonal Recombinant Antibody (Cat# AAA243857)
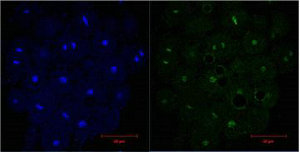
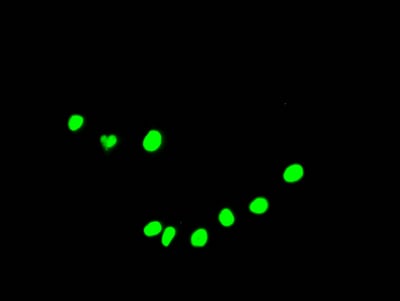
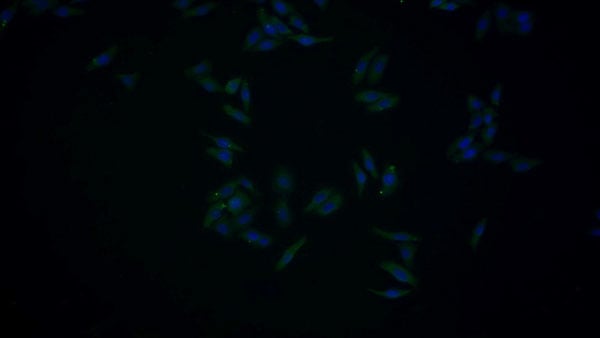
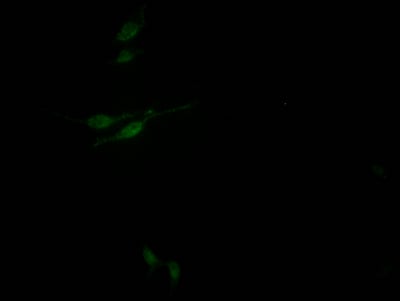 IF (Immunofluorescence)
(Immunofluorescence staining of HepG2 Cells at 1?50, counter-stained with DAPI. The cells were fixed in 4% formaldehyde, permeated by 0.2% TritonX-100, and blocked in 10% normal Goat Serum. The cells were then incubated with the antibody overnight at 4 degree C. Nuclear DNA was labeled in blue with DAPI. The secondary antibody was FITC-conjugated AffiniPure Goat Anti-Rabbit IgG ?H+L?.)
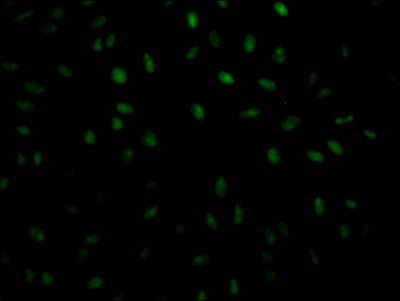
IF (Immunofluorescence)
(Immunofluorescence staining of HepG2 Cells at 1?50, counter-stained with DAPI. The cells were fixed in 4% formaldehyde, permeated by 0.2% TritonX-100, and blocked in 10% normal Goat Serum. The cells were then incubated with the antibody overnight at 4 degree C. Nuclear DNA was labeled in blue with DAPI. The secondary antibody was FITC-conjugated AffiniPure Goat Anti-Rabbit IgG ?H+L?.)
SIN3A, Monoclonal Recombinant Antibody (Cat# AAA243865)
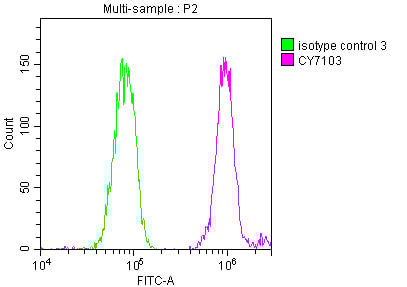
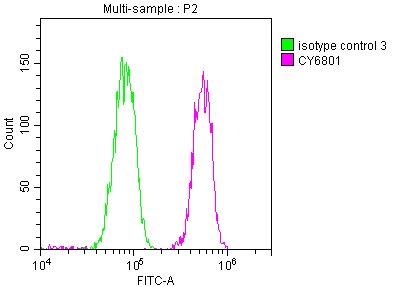 FCM/FACS (Flow Cytometry)
(Overlay histogram showing Hela cells stained with (red line) at 1?50. The cells were fixed with 70% Ethylalcohol (18h) and then incubated in 10% normal goat serum to block non-specific protein-protein interactions followedby the antibody (1ug/1*106cells) for 1 h at 4?.The secondary antibody used was FITC-conjugated goat anti-rabbit IgG (H+L) at 1/200 dilution for 30min at 4?. Control antibody (green line) was Rabbit IgG (1ug/1*106cells) used under the same conditions. Acquisition of >10,000 events was performed.)
FCM/FACS (Flow Cytometry)
(Overlay histogram showing Hela cells stained with (red line) at 1?50. The cells were fixed with 70% Ethylalcohol (18h) and then incubated in 10% normal goat serum to block non-specific protein-protein interactions followedby the antibody (1ug/1*106cells) for 1 h at 4?.The secondary antibody used was FITC-conjugated goat anti-rabbit IgG (H+L) at 1/200 dilution for 30min at 4?. Control antibody (green line) was Rabbit IgG (1ug/1*106cells) used under the same conditions. Acquisition of >10,000 events was performed.)
PABPN1, Monoclonal Recombinant Antibody (Cat# AAA243922)
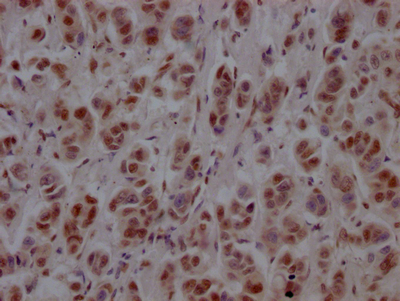
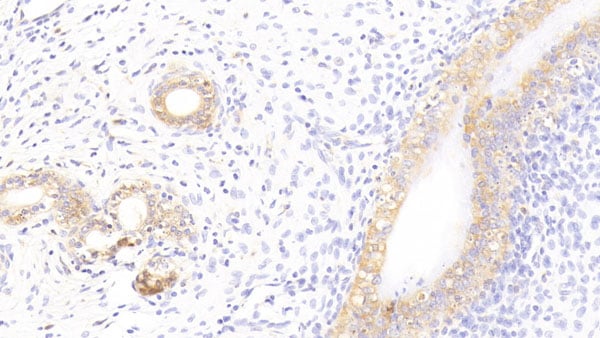
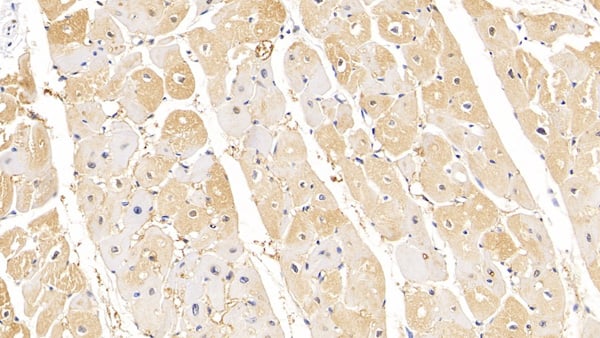
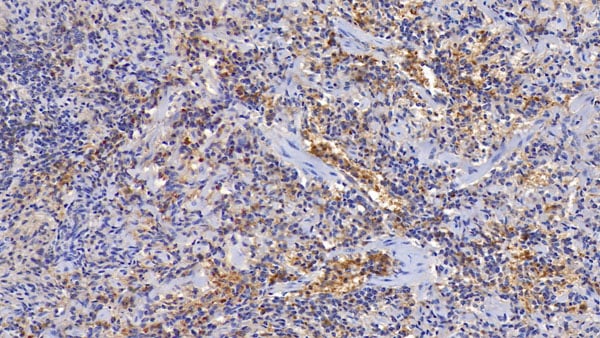
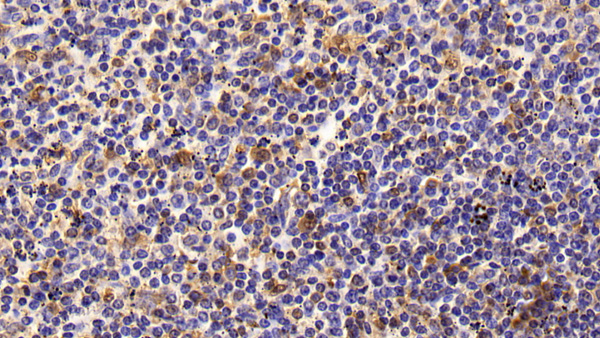
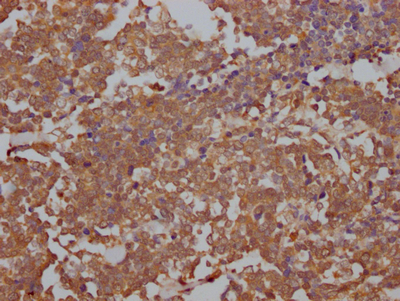 IHC (Immunohiostchemistry)
(IHC image diluted at 1:100 and staining in paraffin-embedded human lung cancer performed on a Leica BondTM system. After dewaxing and hydration, antigen retrieval was mediated by high pressure in a citrate buffer (pH 6.0). Section was blocked with 10% normal goat serum 30min at RT. Then primary antibody (1% BSA) was incubated at 4 degree C overnight. The primary is detected by a Goat anti-rabbit IgG polymer labeled by HRP and visualized using 0.05% DAB.)
IHC (Immunohiostchemistry)
(IHC image diluted at 1:100 and staining in paraffin-embedded human lung cancer performed on a Leica BondTM system. After dewaxing and hydration, antigen retrieval was mediated by high pressure in a citrate buffer (pH 6.0). Section was blocked with 10% normal goat serum 30min at RT. Then primary antibody (1% BSA) was incubated at 4 degree C overnight. The primary is detected by a Goat anti-rabbit IgG polymer labeled by HRP and visualized using 0.05% DAB.)
TOP2A, Monoclonal Recombinant Antibody (Cat# AAA243939)

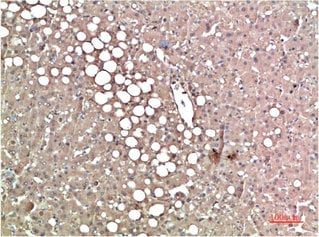
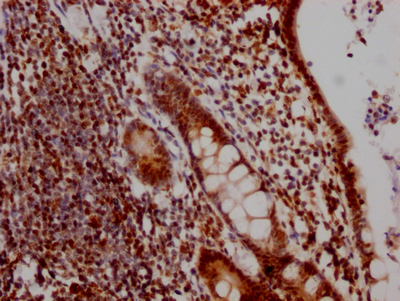
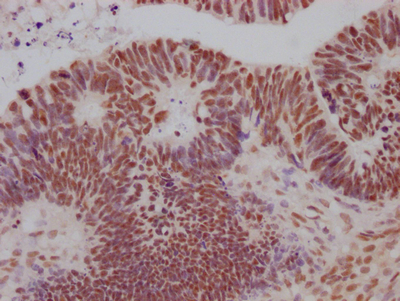
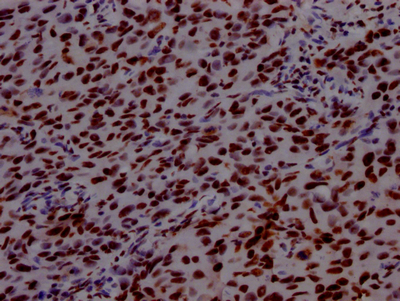
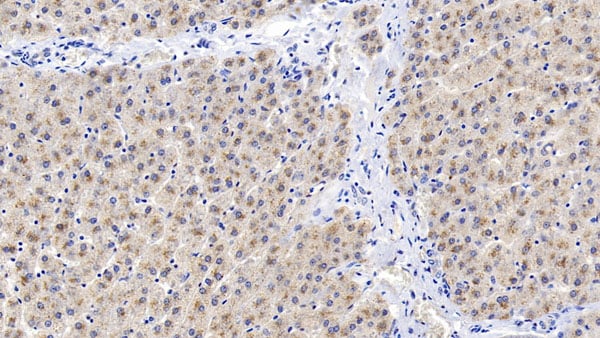
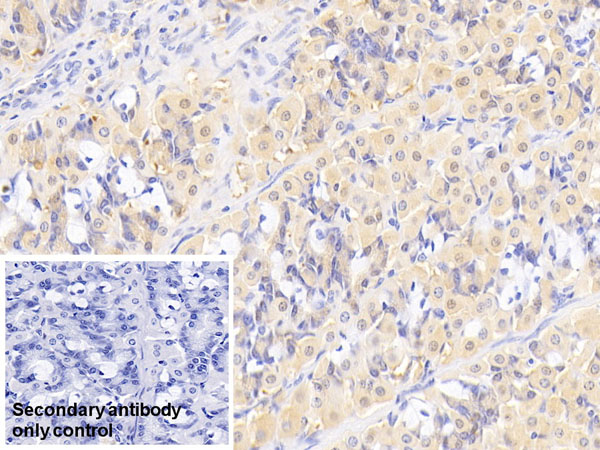
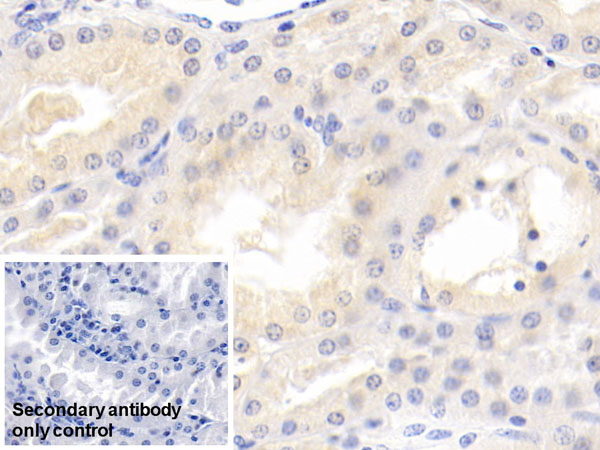
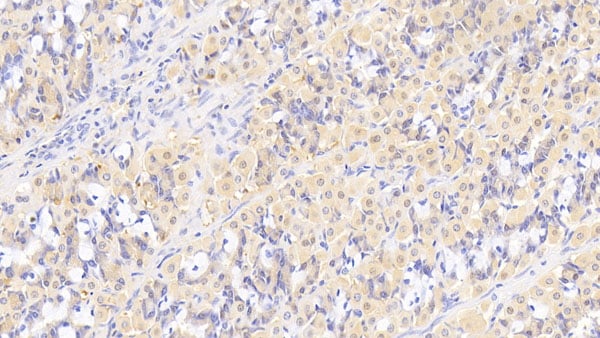
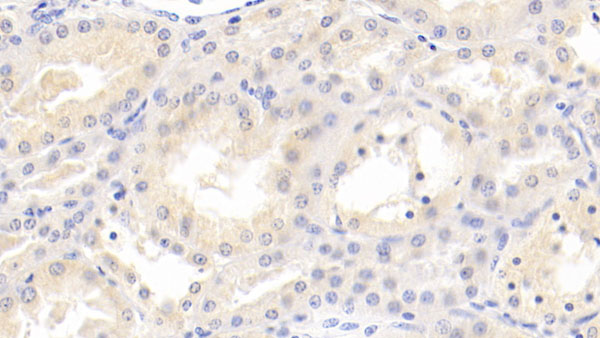
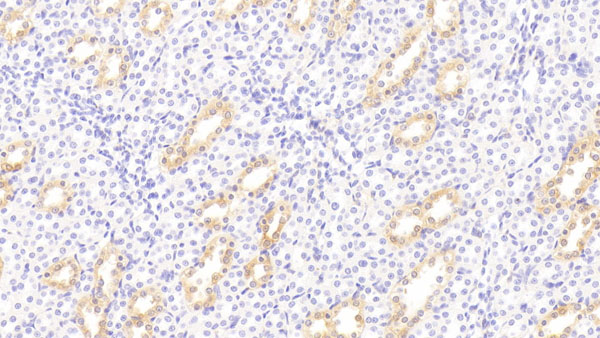
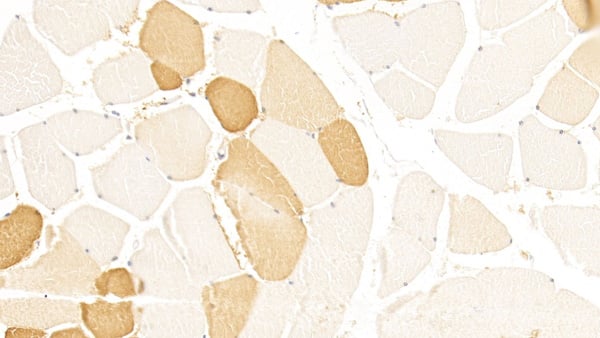
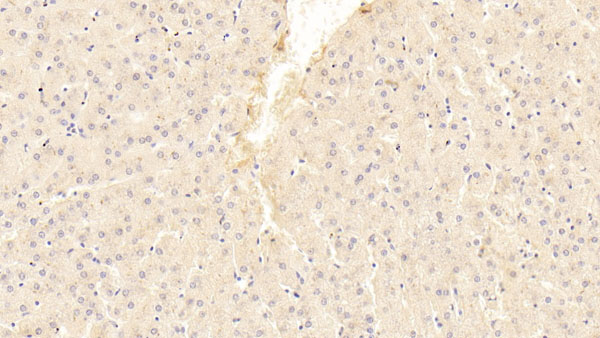
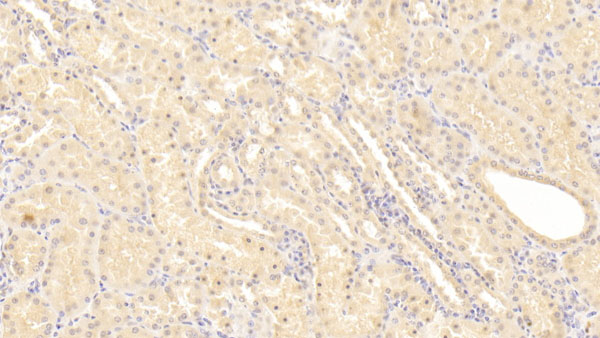
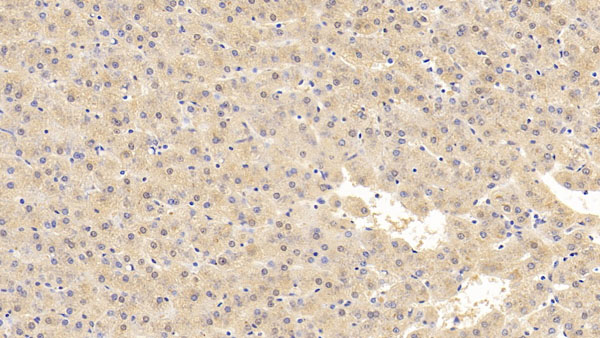
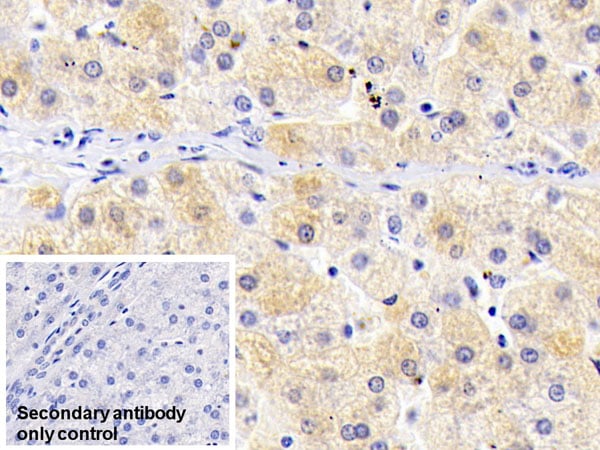
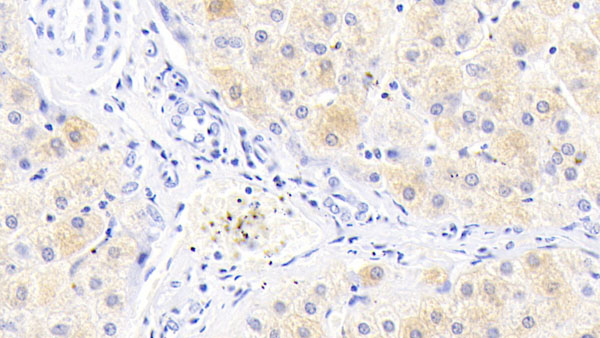
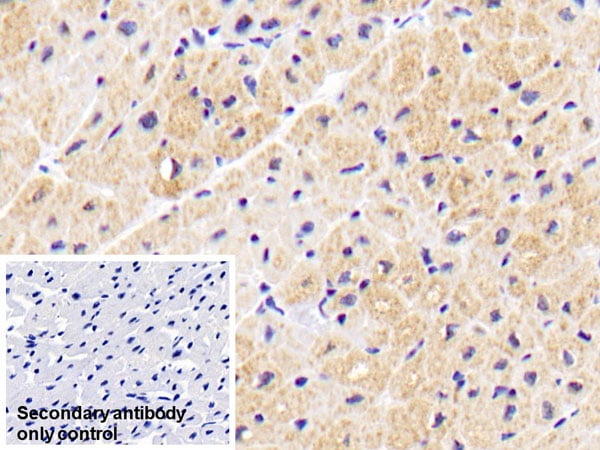
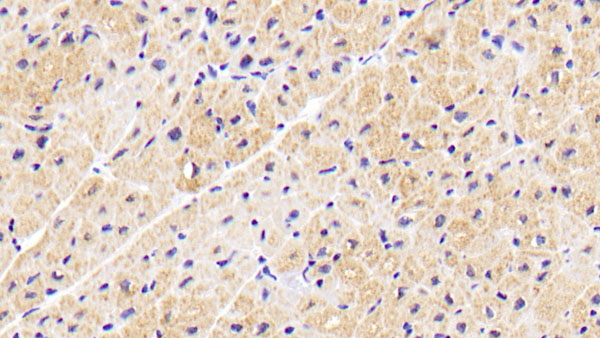
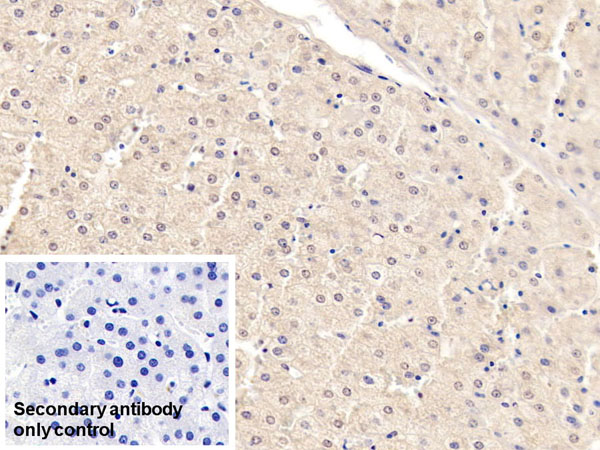
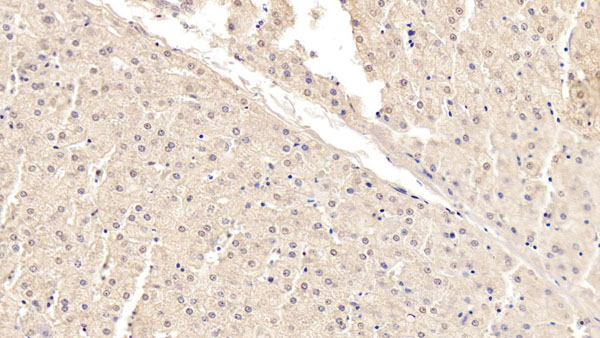
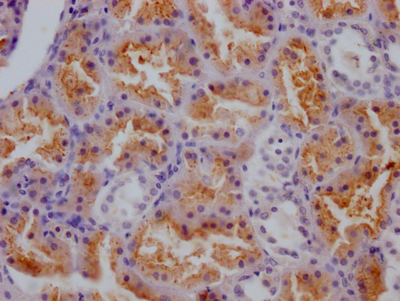 IHC (Immunohiostchemistry)
(IHC image diluted at 1:100 and staining in paraffin-embedded human kidney tissue performed on a Leica BondTM system. After dewaxing and hydration, antigen retrieval was mediated by high pressure in a citrate buffer (pH 6.0). Section was blocked with 10% normal goat serum 30min at RT. Then primary antibody (1% BSA) was incubated at 4 degree C overnight. The primary is detected by a Goat anti-rabbit IgG polymer labeled by HRP and visualized using 0.05% DAB.)
IHC (Immunohiostchemistry)
(IHC image diluted at 1:100 and staining in paraffin-embedded human kidney tissue performed on a Leica BondTM system. After dewaxing and hydration, antigen retrieval was mediated by high pressure in a citrate buffer (pH 6.0). Section was blocked with 10% normal goat serum 30min at RT. Then primary antibody (1% BSA) was incubated at 4 degree C overnight. The primary is detected by a Goat anti-rabbit IgG polymer labeled by HRP and visualized using 0.05% DAB.)
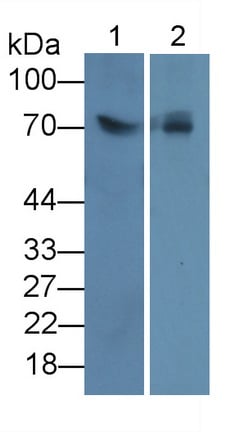
CTSS, Monoclonal Recombinant Antibody (Cat# AAA243951)
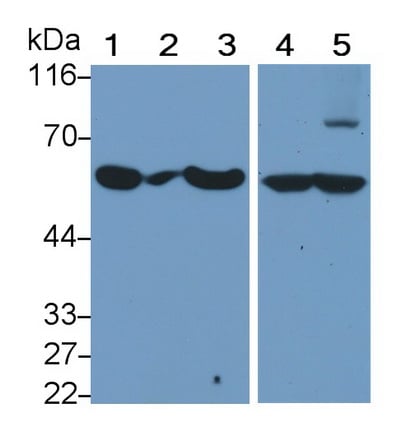 WB (Western Blot)
(Western Blot; Sample: Lane1: Porcine Liver lysate; Lane2: Rat Liver lysate; Lane3: Equine Liver lysate; Lane4: Caprine Liver lysate; Lane5: Cavia Liver lysatePrimary Ab: 1ug/ml Mouse Anti-human CEACAM1 AntibodySecond Ab: 0.2ug/mL HRP-Linked Caprine Anti-Mouse IgG Polyclonal Antibody)
WB (Western Blot)
(Western Blot; Sample: Lane1: Porcine Liver lysate; Lane2: Rat Liver lysate; Lane3: Equine Liver lysate; Lane4: Caprine Liver lysate; Lane5: Cavia Liver lysatePrimary Ab: 1ug/ml Mouse Anti-human CEACAM1 AntibodySecond Ab: 0.2ug/mL HRP-Linked Caprine Anti-Mouse IgG Polyclonal Antibody)
Carcinoembryonic Antigen Related Cell Adhesion Moleule 1 (CEACAM1), Monoclonal Antibody (Cat# AAA152624)
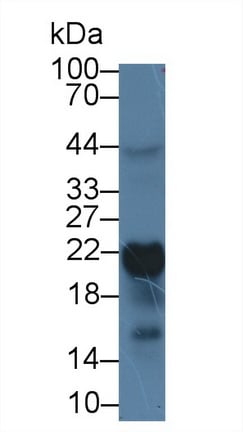
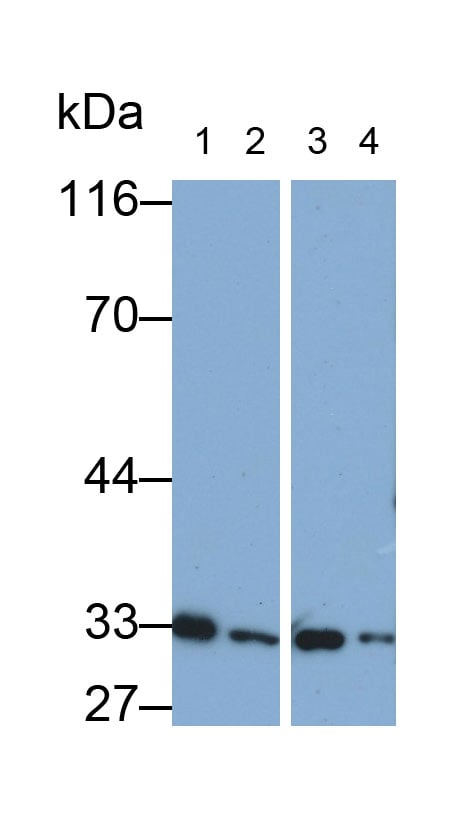 WB (Western Blot)
(Western Blot; Samples: Lane1: human Placenta lysate; Lane2: SKOV3 cell lysate; Lane3: A549 cell lysate; Lane4: HCT116 cell lysate;Primary Ab: 0.1ug/ml Mouse Anti-human MMP7 AntibodySecond Ab: 0.2 ug/ml HRP-Linked Caprine Anti-Mouse IgG Polyclonal Antibody)
WB (Western Blot)
(Western Blot; Samples: Lane1: human Placenta lysate; Lane2: SKOV3 cell lysate; Lane3: A549 cell lysate; Lane4: HCT116 cell lysate;Primary Ab: 0.1ug/ml Mouse Anti-human MMP7 AntibodySecond Ab: 0.2 ug/ml HRP-Linked Caprine Anti-Mouse IgG Polyclonal Antibody)
Matrix Metalloproteinase 7 (MMP7), Monoclonal Antibody (Cat# AAA152627)
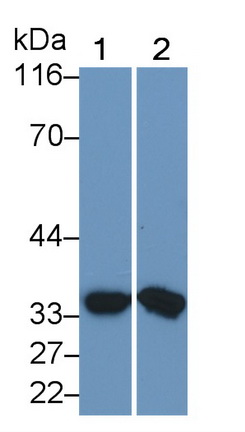
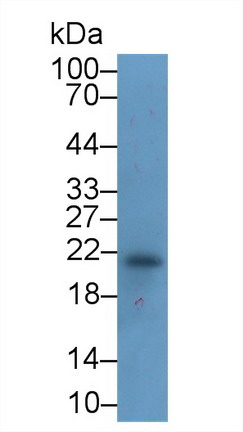
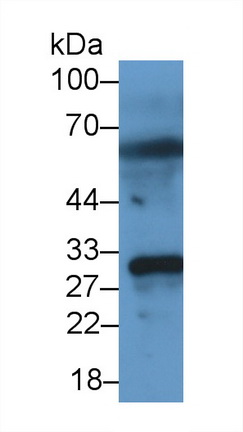 WB (Western Blot)
(Western Blot; Sample: human Urine Primary Ab: 3ug/ml Mouse Anti-human MMP7 Antibody Second Ab: 0.2ug/mL HRP-Linked Caprine Anti-Mouse IgG Polyclonal Antibody)
WB (Western Blot)
(Western Blot; Sample: human Urine Primary Ab: 3ug/ml Mouse Anti-human MMP7 Antibody Second Ab: 0.2ug/mL HRP-Linked Caprine Anti-Mouse IgG Polyclonal Antibody)
Matrix Metalloproteinase 7 (MMP7), Monoclonal Antibody (Cat# AAA152628)
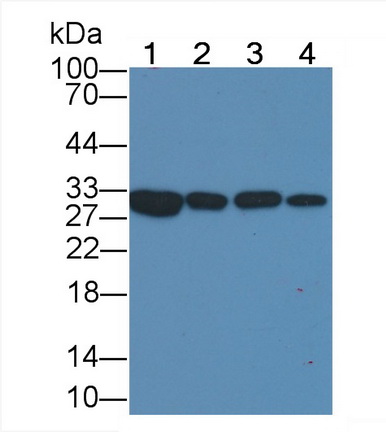 WB (Western Blot)
(Western Blot; Sample: Lane1: Rat Spleen lysate; Lane2: Rat Lung lysate; Lane3: Rat Testis lysate; Lane4: Hela cell lysate Primary Ab: 2 ug/ml Mouse Anti-Rat GAL3 Antibody Second Ab: 0.2ug/mL HRP-Linked Caprine Anti-Mouse IgG Polyclonal Antibody)
WB (Western Blot)
(Western Blot; Sample: Lane1: Rat Spleen lysate; Lane2: Rat Lung lysate; Lane3: Rat Testis lysate; Lane4: Hela cell lysate Primary Ab: 2 ug/ml Mouse Anti-Rat GAL3 Antibody Second Ab: 0.2ug/mL HRP-Linked Caprine Anti-Mouse IgG Polyclonal Antibody)
Galectin 3 (GAL3), Monoclonal Antibody (Cat# AAA152633)
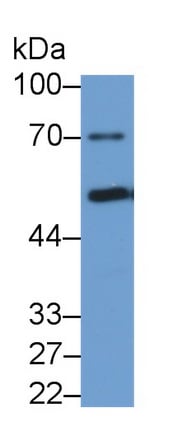
 WB (Western Blot)
(Western Blot; Sample: Lane1: Rat Liver lysate; Lane2: 293T cell lysate Primary Ab: 2ug/ml Mouse Anti-human LSR Antibody Second Ab: 0.2ug/mL HRP-Linked Caprine Anti-Mouse IgG Polyclonal Antibody)
WB (Western Blot)
(Western Blot; Sample: Lane1: Rat Liver lysate; Lane2: 293T cell lysate Primary Ab: 2ug/ml Mouse Anti-human LSR Antibody Second Ab: 0.2ug/mL HRP-Linked Caprine Anti-Mouse IgG Polyclonal Antibody)
Lipolysis Stiulated Lipoprotein Receptor (LSR), Monoclonal Antibody (Cat# AAA152639)
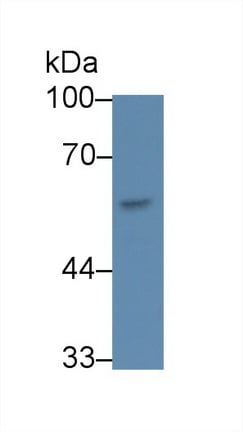
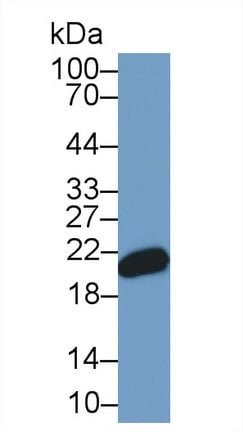
 WB (Western Blot)
(Western Blot; Sample: human SeuM Primary Ab: 2 ug/ml Mouse Anti-human PAH Antibody Second Ab: 0.2ug/mL HRP-Linked Caprine Anti-Mouse IgG Polyclonal Antibody)
WB (Western Blot)
(Western Blot; Sample: human SeuM Primary Ab: 2 ug/ml Mouse Anti-human PAH Antibody Second Ab: 0.2ug/mL HRP-Linked Caprine Anti-Mouse IgG Polyclonal Antibody)
Phenylalanine Hydroxylase (PAH), Monoclonal Antibody (Cat# AAA152653)
 WB (Western Blot)
(Western Blot; Sample: U87MG cell lysate Primary Ab: 2ug/ml Mouse Anti-human FTH Antibody Second Ab: 0.2ug/mL HRP-Linked Caprine Anti-Mouse IgG Polyclonal Antibody)
WB (Western Blot)
(Western Blot; Sample: U87MG cell lysate Primary Ab: 2ug/ml Mouse Anti-human FTH Antibody Second Ab: 0.2ug/mL HRP-Linked Caprine Anti-Mouse IgG Polyclonal Antibody)
Ferritin, Heavy Polypeptide (FTH), Monoclonal Antibody (Cat# AAA152655)
 WB (Western Blot)
(Western Blot; Sample: Jurkat cell lysate Primary Ab: 2 ug/ml Mouse Anti-human CD3e Antibody Second Ab: 0.2ug/mL HRP-Linked Caprine Anti-Mouse IgG Polyclonal Antibody)
WB (Western Blot)
(Western Blot; Sample: Jurkat cell lysate Primary Ab: 2 ug/ml Mouse Anti-human CD3e Antibody Second Ab: 0.2ug/mL HRP-Linked Caprine Anti-Mouse IgG Polyclonal Antibody)
T-Cell Surface Glycoprotein CD3 Epsilon (CD3e), Monoclonal Antibody (Cat# AAA152656)
 WB (Western Blot)
(Western Blot; Sample: Rat Liver lysate Primary Ab: 1.5ug/ml Mouse Anti-human FTH Antibody Second Ab: 0.2ug/mL HRP-Linked Caprine Anti-Mouse IgG Polyclonal Antibody)
WB (Western Blot)
(Western Blot; Sample: Rat Liver lysate Primary Ab: 1.5ug/ml Mouse Anti-human FTH Antibody Second Ab: 0.2ug/mL HRP-Linked Caprine Anti-Mouse IgG Polyclonal Antibody)
Ferritin, Heavy Polypeptide (FTH), Monoclonal Antibody (Cat# AAA152665)
 WB (Western Blot)
(Western Blot; Sample: Lane1: human Placenta lysate; Lane2: Rat Liver lysate; Lane3: Rat Spleen lysate Primary Ab: 2 ug/ml Mouse Anti-human FTL Antibody Second Ab: 0.2ug/mL HRP-Linked Caprine Anti-Mouse IgG Polyclonal Antibody)
WB (Western Blot)
(Western Blot; Sample: Lane1: human Placenta lysate; Lane2: Rat Liver lysate; Lane3: Rat Spleen lysate Primary Ab: 2 ug/ml Mouse Anti-human FTL Antibody Second Ab: 0.2ug/mL HRP-Linked Caprine Anti-Mouse IgG Polyclonal Antibody)
Ferritin, Light Polypeptide (FTL), Monoclonal Antibody (Cat# AAA152668)
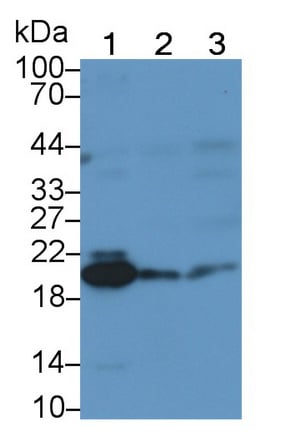
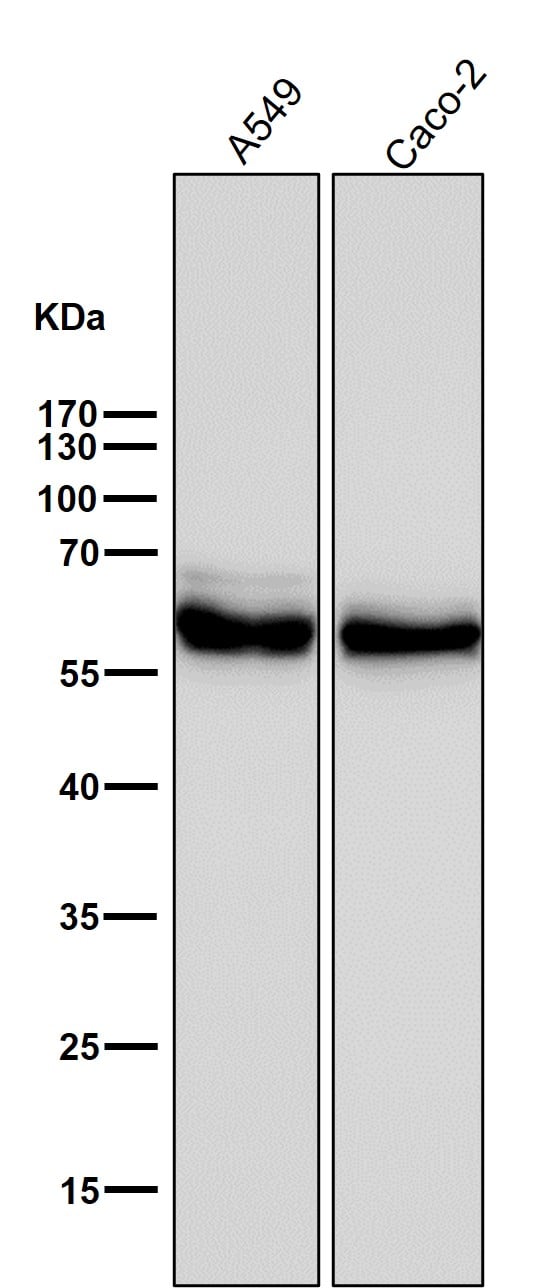
 WB (Western Blot)
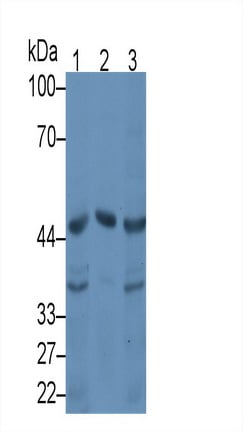
(Western Blot; Sample: Lane1: Rat Liver lysate; Lane2: Rat Ovary lysate; Lane3: HepG2 cell lysate Primary Ab: 3ug/ml Mouse Anti-human ZPI Antibody Second Ab: 0.2ug/mL HRP-Linked Caprine Anti-Mouse IgG Polyclonal Antibody)
WB (Western Blot)
(Western Blot; Sample: Lane1: Rat Liver lysate; Lane2: Rat Ovary lysate; Lane3: HepG2 cell lysate Primary Ab: 3ug/ml Mouse Anti-human ZPI Antibody Second Ab: 0.2ug/mL HRP-Linked Caprine Anti-Mouse IgG Polyclonal Antibody)
Serpin A10 (SERPINA10), Monoclonal Antibody (Cat# AAA152673)
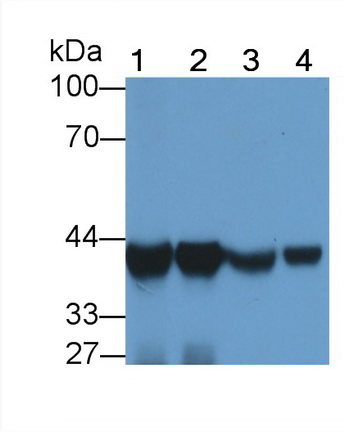 WB (Western Blot)
(Western Blot; Sample: Lane1: Rat Liver lysate; Lane2: Rat CerebuM lysate; Lane3: Rat Spleen lysate; Lane4: HepG2 cell lysate Primary Ab: 2ug/ml Mouse Anti-human AST2 Antibody Second Ab: 0.2ug/mL HRP-Linked Caprine Anti-Mouse IgG Polyclonal Antibody)
WB (Western Blot)
(Western Blot; Sample: Lane1: Rat Liver lysate; Lane2: Rat CerebuM lysate; Lane3: Rat Spleen lysate; Lane4: HepG2 cell lysate Primary Ab: 2ug/ml Mouse Anti-human AST2 Antibody Second Ab: 0.2ug/mL HRP-Linked Caprine Anti-Mouse IgG Polyclonal Antibody)
Aspartate Aminotransferase 2 (AST2), Monoclonal Antibody (Cat# AAA152678)
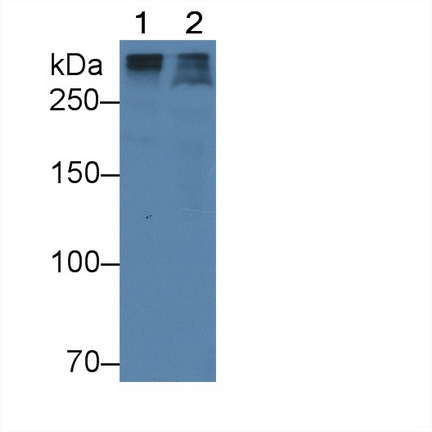 WB (Western Blot)
(Western Blot; Sample: Lane1: human SeuM; Lane2: human Plasma Primary Ab: 3ug/ml Mouse Anti-human APOB Antibody Second Ab: 0.2ug/mL HRP-Linked Caprine Anti-Mouse IgG Polyclonal Antibody)
WB (Western Blot)
(Western Blot; Sample: Lane1: human SeuM; Lane2: human Plasma Primary Ab: 3ug/ml Mouse Anti-human APOB Antibody Second Ab: 0.2ug/mL HRP-Linked Caprine Anti-Mouse IgG Polyclonal Antibody)
Apolipoprotein B (APOB), Monoclonal Antibody (Cat# AAA152685)
CD64, Monoclonal Antibody (Cat# AAA128245)
CD64, Monoclonal Antibody (Cat# AAA128250)
 FCM/FACS (Flow Cytometry)
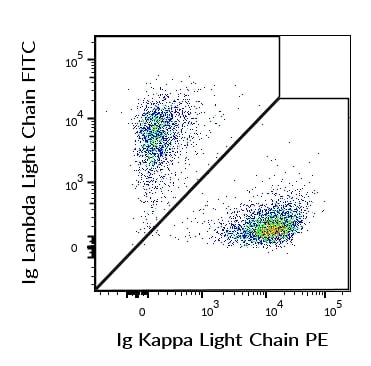
(Flow cytometry multicolor surface staining of human CD19 positive B cells using anti-human Ig Kappa Light Chain (TB28-2) PE antibody (10 ul reagent / 100 ul of peripheral whole blood) and anti-human Ig Lambda Light Chain (1-155-2) FITC antibody (4 ul reagent / 100 ul of peripheral whole blood).)
FCM/FACS (Flow Cytometry)
(Flow cytometry multicolor surface staining of human CD19 positive B cells using anti-human Ig Kappa Light Chain (TB28-2) PE antibody (10 ul reagent / 100 ul of peripheral whole blood) and anti-human Ig Lambda Light Chain (1-155-2) FITC antibody (4 ul reagent / 100 ul of peripheral whole blood).)
Ig Lambda Light Chain, Monoclonal Antibody (Cat# AAA128257)
CD206, Monoclonal Antibody (Cat# AAA128270)
CD326, Monoclonal Antibody (Cat# AAA128320)
CD326, Monoclonal Antibody (Cat# AAA128322)
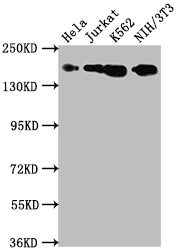
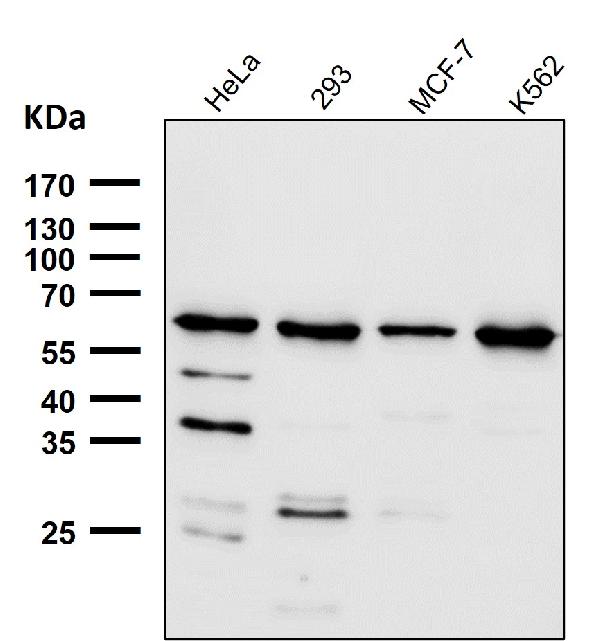
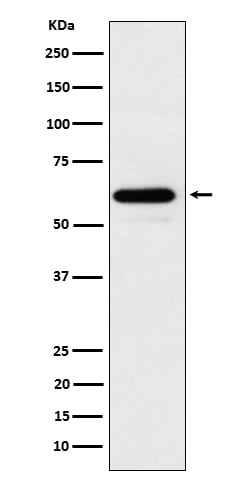
 WB (Western Blot)
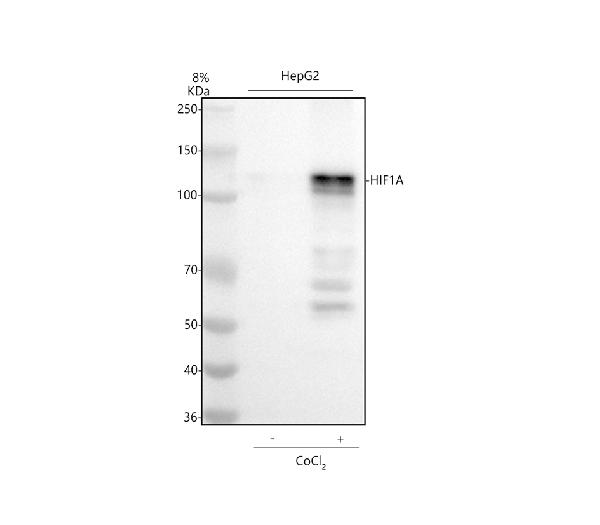
(Figure 1. Western blot analysis of HIF-1-Alpha using anti-HIF-1-Alpha antibody (AAA128102).Electrophoresis was performed on a 5-20% SDS-PAGE gel at 70V (Stacking gel)/90V (Resolving gel) for 2-3 hours. The sample well of each lane was loaded with 30 ug of sample under reducing conditions.Lane 1: human HepG2 whole cell lysates.After electrophoresis, proteins were transferred to a nitrocellulose membrane at 150 mA for 50-90 minutes. Blocked the membrane with 5% non-fat milk/TBS for 1.5 hour at RT. The membrane was incubated with rabbit anti-HIF-1-Alpha antigen affinity purified monoclonal antibody (#AAA128102) at 1:500 overnight at 4 degree C, then washed with TBS-0.1%Tween 3 times with 5 minutes each and probed with a goat anti-rabbit IgG-HRP secondary antibody at a dilution of 1:500 for 1.5 hour at RT. The signal is developed using an Enhanced Chemiluminescent detection (ECL) kit with Tanon 5200 system. A specific band was detected for HIF-1-Alpha at approximately 110 kDa. The expected band size for HIF-1-Alpha is at 110 kDa.)
WB (Western Blot)
(Figure 1. Western blot analysis of HIF-1-Alpha using anti-HIF-1-Alpha antibody (AAA128102).Electrophoresis was performed on a 5-20% SDS-PAGE gel at 70V (Stacking gel)/90V (Resolving gel) for 2-3 hours. The sample well of each lane was loaded with 30 ug of sample under reducing conditions.Lane 1: human HepG2 whole cell lysates.After electrophoresis, proteins were transferred to a nitrocellulose membrane at 150 mA for 50-90 minutes. Blocked the membrane with 5% non-fat milk/TBS for 1.5 hour at RT. The membrane was incubated with rabbit anti-HIF-1-Alpha antigen affinity purified monoclonal antibody (#AAA128102) at 1:500 overnight at 4 degree C, then washed with TBS-0.1%Tween 3 times with 5 minutes each and probed with a goat anti-rabbit IgG-HRP secondary antibody at a dilution of 1:500 for 1.5 hour at RT. The signal is developed using an Enhanced Chemiluminescent detection (ECL) kit with Tanon 5200 system. A specific band was detected for HIF-1-Alpha at approximately 110 kDa. The expected band size for HIF-1-Alpha is at 110 kDa.)
HIF-1-alpha, Monoclonal Antibody (Cat# AAA128102)
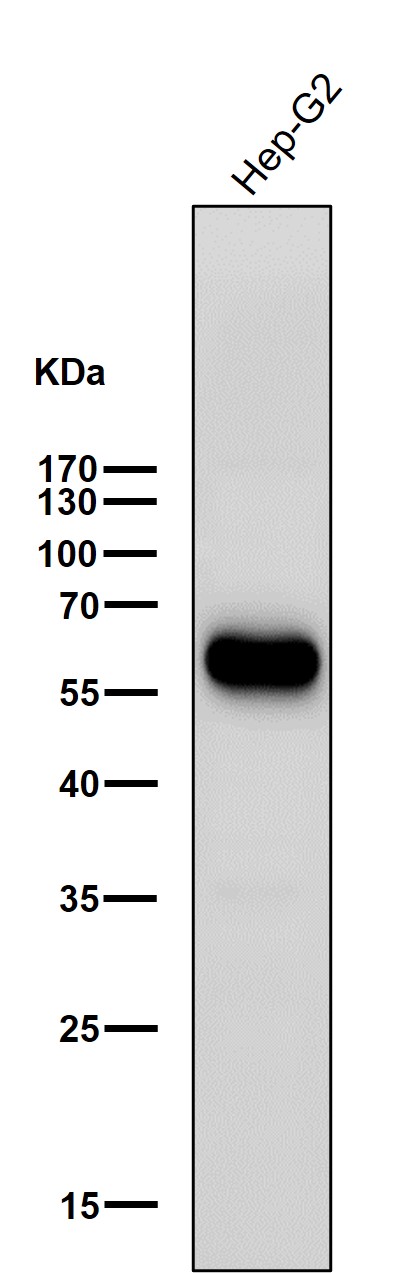
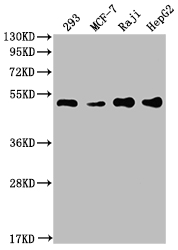
 WB (Western Blot)
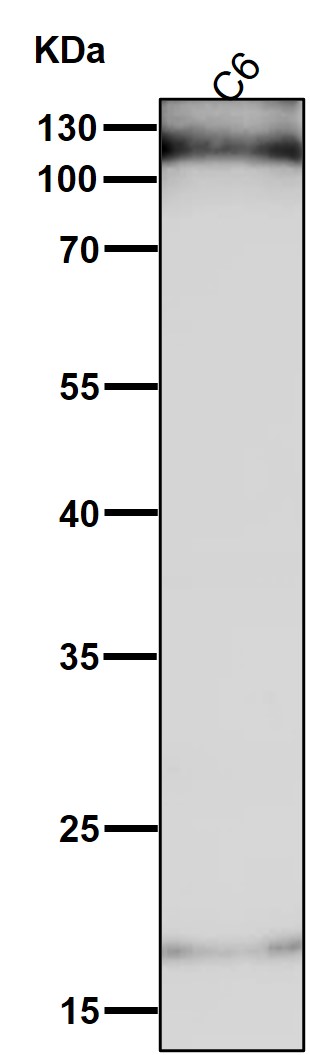
(Western blot analysis of ALDH2 expression in HepG2 cell lysate.)
WB (Western Blot)
(Western blot analysis of ALDH2 expression in HepG2 cell lysate.)
ALDH2, Monoclonal Antibody (Cat# AAA128120)
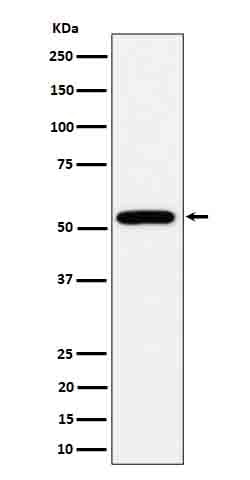
 WB (Western Blot)
(Western blot analysis of HRPT2/CDC73 expression in 293T cell lysate.)
WB (Western Blot)
(Western blot analysis of HRPT2/CDC73 expression in 293T cell lysate.)
HRPT2/CDC73, Monoclonal Antibody (Cat# AAA128138)
CD235a, Monoclonal Antibody (Cat# AAA128640)
CD62L, Monoclonal Antibody (Cat# AAA128705)
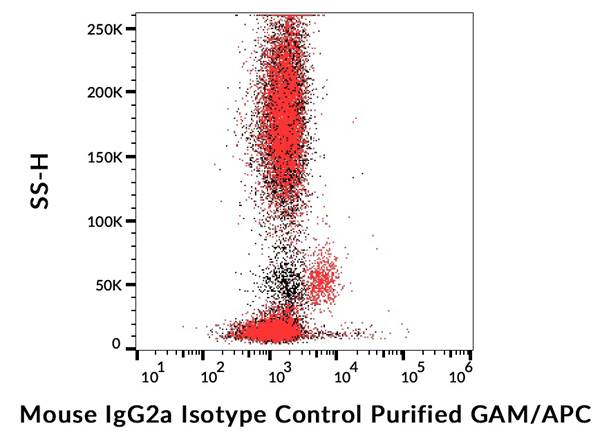 FCM/FACS (Flow Cytometry)
(Example of nonspecific mouse IgG2a (MOPC-173) purified / GAM-APC signal (red) on human peripheral blood compared with blank (black).)
FCM/FACS (Flow Cytometry)
(Example of nonspecific mouse IgG2a (MOPC-173) purified / GAM-APC signal (red) on human peripheral blood compared with blank (black).)
IgG2a, Monoclonal Isotype Control (Cat# AAA128885)
IgG1, Monoclonal Isotype Control (Cat# AAA128888)
CD62L, Monoclonal Antibody (Cat# AAA128506)
CD279, Monoclonal Antibody (Cat# AAA128517)
CD3 zeta, Monoclonal Antibody (Cat# AAA128534)
CD203c, Monoclonal Antibody (Cat# AAA128908)
OPAL1, Monoclonal Antibody (Cat# AAA128917)
CD4, Monoclonal Antibody (Cat# AAA128926)
CD150, Monoclonal Antibody (Cat# AAA128959)
CD229, Monoclonal Antibody (Cat# AAA128596)
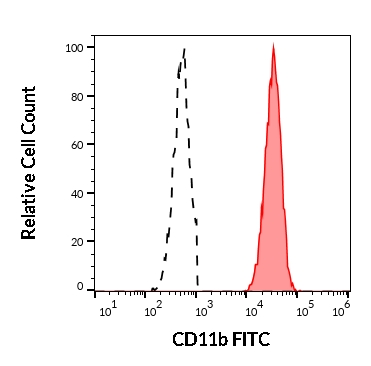
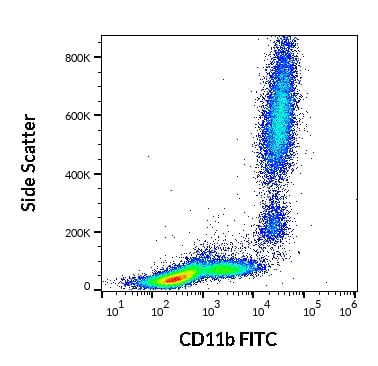 FCM/FACS (Flow Cytometry)
(Flow cytometry surface staining pattern of human peripheral whole blood stained using anti-human CD11b (ICRF44) FITC antibody (4 ul reagent / 100 ul of peripheral whole blood).)
FCM/FACS (Flow Cytometry)
(Flow cytometry surface staining pattern of human peripheral whole blood stained using anti-human CD11b (ICRF44) FITC antibody (4 ul reagent / 100 ul of peripheral whole blood).)
CD11b, Monoclonal Antibody (Cat# AAA128621)
 FCM/FACS (Flow Cytometry)
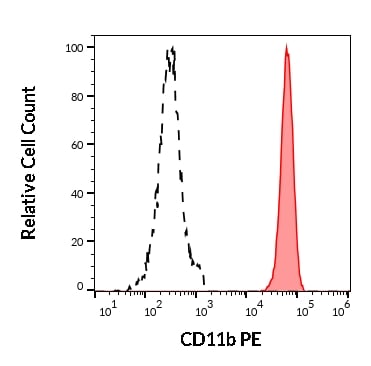
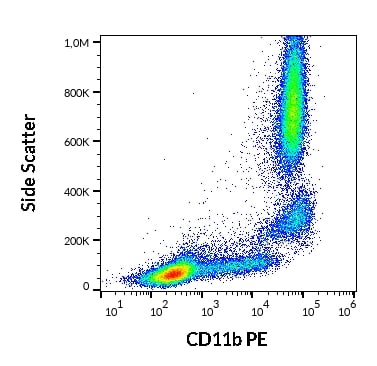
(Flow cytometry surface staining pattern of human peripheral whole blood stained using anti-human CD11b (ICRF44) PE antibody (10 ul reagent / 100 ul of peripheral whole blood).)
FCM/FACS (Flow Cytometry)
(Flow cytometry surface staining pattern of human peripheral whole blood stained using anti-human CD11b (ICRF44) PE antibody (10 ul reagent / 100 ul of peripheral whole blood).)
CD11b, Monoclonal Antibody (Cat# AAA128622)
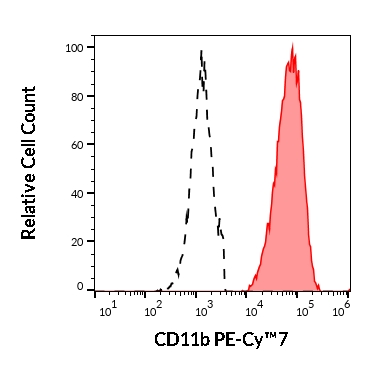
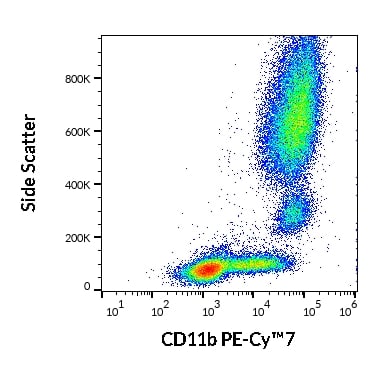 FCM/FACS (Flow Cytometry)
(Flow cytometry surface staining pattern of human peripheral whole blood stained using anti-human CD11b (ICRF44) PE-Cy™7 antibody (4 ul reagent / 100 ul of peripheral whole blood).)
FCM/FACS (Flow Cytometry)
(Flow cytometry surface staining pattern of human peripheral whole blood stained using anti-human CD11b (ICRF44) PE-Cy™7 antibody (4 ul reagent / 100 ul of peripheral whole blood).)
CD11b, Monoclonal Antibody (Cat# AAA128623)
CD99, Monoclonal Antibody (Cat# AAA128329)
CD8a, Monoclonal Antibody (Cat# AAA128368)
What are Monoclonal Antibodies?
Monoclonal antibodies are specialized laboratory-produced proteins developed for binding to specific biological antigens or other molecular targets. Since they come from a single cell (or clone), they are especially consistent and accurate in the data they are involved in producing.
This type of antibody material has been shown to be a powerful tool in finding and subsequently destroying harmful cells in an organism, such as those found in cancers or various autoimmune diseases. This makes them excellent aids in medical testing and research, which is why they are so widely used.
AAA Biotech offers a comprehensive range of high-quality monoclonal antibodies that perform effectively in various laboratory tests, including (amongst others) ELISA, western blotting, immunohistochemistry, and flow cytometry. All of the products in our catalog are thoroughly quality tested to make sure that they are reliable and will consistently perform well in your research.
What Are The Uses of Monoclonal Antibodies
Monoclonal antibodies are used in many lab tests, including (amongst others) ELISA, western blotting, immunohistochemistry, and flow cytometry.
ELISA is a test that helps detect a specific substance/analyte in a sample. It uses antibodies (often monoclonal) bound to a solid surface (such as the well of a microplate) to “capture” the substance/analyte in the sample and immobilize it so that the detection antibody component can then bind to it and produce a signal, which can then be measured.
Western blotting identifies specific proteins in a sample. The sample is first separated on a gel, and then antibodies are applied that will typically bind to the target, which will all be localized to a single band in a lane.
Immunohistochemistry helps locate specific proteins in cells or tissue samples using antibodies.
Flow cytometry looks at and sorts cells. It uses antibodies that are conjugated to reporter molecules called “fluorophores”, which, under special lights, emit light themselves, which can then be measured by a detector instrument. For a deeper understanding of these techniques, explore our complete guide to monoclonal antibodies and their benefits.
How Monoclonal Antibodies Are Used as Medicine?
Please note that all of the products listed in AAA Biotech’s also known as AAA Bio or AAABio catalog are strictly for research-use only (RUO).
Monoclonal antibodies can also be used as therapeutic/medical treatments, particularly in the context of cancers. They are designed to find and bind to specific cells or proteins, helping the immune system recognize and attack the cancer. These treatments work in different ways, such as:
- Radioimmunotherapy attaches a small amount of radioactive molecule to the antibody, so it delivers the radiation directly to the cancer cells that the antibody is specifically binding to.
- Antibody-directed enzyme prodrug therapy uses antibodies that are specifically bound to special enzymes. These enzymes activate a harmless drug in the body and turn it into a cancer-killing drug only near the cancer cells—this helps avoid harming healthy cells.
- Immunoliposomes are tiny “bubbles” filled with medicine/drug and coated with antibodies. They carry the drug straight to the cancer cells.
Why Buy Monoclonal Antibodies From Us?
At AAA Biotech, we provide high-performance monoclonal antibodies designed to support a wide range of research needs.
1. Validated for Versatile Applications
The antibodies in our catalog are extensively validated and compatible with multiple techniques, including (but not limited to) ELISA, flow cytometry (FC), immunocytochemistry (ICC), immunofluorescence (IF), immunohistochemistry (IHC), immunoprecipitation (IP), and western blotting (WB).
2. Wide Selection & Specialized Options
We offer antibodies for common and rare species, that are available in various conjugated forms, and also in recombinant formats. Essentially, there is almost anything one might need to meet their experimental model’s requirements.
3. High-Quality Proteins
Our proteins meet high purity standards—90% or more as confirmed by SDS-PAGE. Many are available with tags like His, Flag, GST, or MBP, and we also supply native and biologically active proteins for functional studies.
Frequently Asked Questions
1. Are your monoclonal antibodies validated for specific applications?
Yes, our antibodies are tested and validated for use in methods such as ELISA, western blot, IHC, flow cytometry, and more. Refer to specific product pages or datasheets for individual product information.
2. How do I choose the right monoclonal antibody for my application?
Review the product details directly for application validation, species reactivity, and target information. You may also contact our support team at any time for help.
3. How quickly can I receive my order?
Most orders are processed and shipped within 1–3 business days, depending on product availability and your shipping location.